Bank of America 2012 Annual Report Download - page 46
Download and view the complete annual report
Please find page 46 of the 2012 Bank of America annual report below. You can navigate through the pages in the report by either clicking on the pages listed below, or by using the keyword search tool below to find specific information within the annual report.-
 1
1 -
2
-
3
-
4
-
5
-
6
-
7
-
8
-
9
-
10
-
11
-
12
-
13
-
14
-
15
-
16
-
17
-
18
-
19
-
20
-
21
-
22
-
23
-
24
-
25
-
26
-
27
-
28
-
29
-
30
-
31
-
32
-
33
-
34
-
35
-
 36
36 -
 37
37 -
 38
38 -
 39
39 -
 40
40 -
 41
41 -
 42
42 -
 43
43 -
 44
44 -
 45
45 -
 46
46 -
 47
47 -
 48
48 -
 49
49 -
 50
50 -
 51
51 -
 52
52 -
 53
53 -
 54
54 -
 55
55 -
 56
56 -
57
-
58
-
59
-
60
-
61
-
62
-
63
-
64
-
65
-
66
-
67
-
68
-
69
-
70
-
71
-
72
-
73
-
74
-
75
-
76
-
77
-
78
-
79
-
80
-
81
-
82
-
83
-
84
-
85
-
86
-
87
-
88
-
89
-
90
-
91
-
92
-
93
-
94
-
95
-
96
-
97
-
98
-
99
-
100
-
101
-
102
-
103
-
104
-
105
-
106
-
107
-
108
-
109
-
110
-
111
-
112
-
113
-
114
-
115
-
116
-
117
-
118
-
119
-
120
-
121
-
122
-
123
-
124
-
125
-
126
-
127
-
128
-
129
-
130
-
131
-
132
-
133
-
134
-
135
-
136
-
137
-
138
-
139
-
140
-
141
-
142
-
143
-
144
-
145
-
146
-
147
-
148
-
149
-
150
-
151
-
152
-
153
-
154
-
155
-
156
-
157
-
158
-
159
-
160
-
161
-
162
-
163
-
164
-
165
-
166
-
167
-
168
-
169
-
170
-
171
-
172
-
173
-
174
-
175
-
176
-
177
-
178
-
179
-
180
-
181
-
182
-
183
-
184
-
185
-
186
-
187
-
188
-
189
-
190
-
191
-
192
-
193
-
194
-
195
-
196
-
197
-
198
-
199
-
200
-
201
-
202
-
203
-
204
-
205
-
206
-
207
-
208
-
209
-
210
-
211
-
212
-
213
-
214
-
215
-
216
-
217
-
218
-
219
-
220
-
221
-
222
-
223
-
224
-
225
-
226
-
227
-
228
-
229
-
230
-
231
-
232
-
233
-
234
-
235
-
236
-
237
-
238
-
239
-
240
-
241
-
242
-
243
-
244
-
245
-
246
-
247
-
248
-
249
-
250
-
251
-
252
-
253
-
254
-
255
-
256
-
257
-
258
-
259
-
260
-
261
-
262
-
263
-
264
-
265
-
266
-
267
-
268
-
269
-
270
-
271
-
272
-
273
-
274
-
275
-
276
-
277
-
278
-
279
-
280
-
281
-
282
-
283
-
284
 |
 |

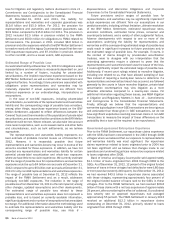
44 Bank of America 2012
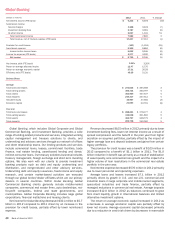
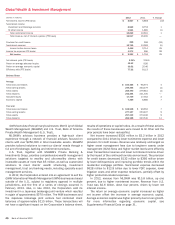
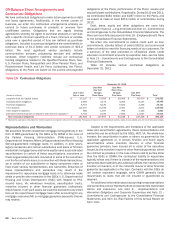
Global Markets
(Dollars in millions) 2012 2011 % Change
Net interest income (FTE basis) $ 3,310 $ 3,682 (10)%
Noninterest income:
Investment and brokerage services 1,820 2,249 (19)
Investment banking fees 2,214 2,214 —
Trading account profits 5,706 6,417 (11)
All other income 469 236 99
Total noninterest income 10,209 11,116 (8)
Total revenue, net of interest expense (FTE basis) 13,519 14,798 (9)
Provision for credit losses 3(56) n/m
Noninterest expense 10,839 12,244 (11)
Income before income taxes 2,677 2,610 3
Income tax expense (FTE basis) 1,623 1,622 —
Net income $ 1,054 $ 988 7
Return on average allocated equity 5.99%4.36%
Return on average economic capital 8.20 5.54
Efficiency ratio (FTE basis) 80.18 82.75
Balance Sheet
Average
Total trading-related assets (1) $ 466,045 $ 472,446 (1)
Total earning assets (1) 449,660 445,574 1
Total assets 588,459 590,474 —
Allocated equity 17,595 22,671 (22)
Economic capital 12,956 18,046 (28)
Year end
Total trading-related assets (1) $ 465,836 $ 397,876 17
Total earning assets (1) 474,335 372,894 27
Total assets 615,297 501,867 23
(1) Trading-related assets include assets which are not considered earning assets (i.e., derivative assets).
n/m = not meaningful
Global Markets offers sales and trading services, including
research, to institutional clients across fixed-income, credit,
currency, commodity and equity businesses. Global Markets
product coverage includes securities and derivative products in
both the primary and secondary markets. Global Markets provides
market-making, financing, securities clearing, settlement and
custody services globally to our institutional investor clients in
support of their investing and trading activities. We also work with
our commercial and corporate clients to provide risk management
products using interest rate, equity, credit, currency and commodity
derivatives, foreign exchange, fixed-income and mortgage-related
products. As a result of our market-making activities in these
products, we may be required to manage risk in government
securities, equity and equity-linked securities, high-grade and high-
yield corporate debt securities, commercial paper, MBS,
commodities and asset-backed securities (ABS). In addition, the
economics of certain investment banking and underwriting
activities are shared primarily between Global Markets and Global
Banking based on the activities performed by each segment. Global
Banking originates certain deal-related transactions with our
corporate and commercial clients that are executed and
distributed by Global Markets. For additional information on
investment banking fees on a consolidated basis, see page 43.
Net income for Global Markets increased $66 million to $1.1
billion in 2012 compared to 2011. In 2012, net DVA losses were
$2.4 billion compared to net DVA gains of $1.0 billion in 2011.
Excluding net DVA, net income increased $2.2 billion to $2.6 billion
primarily driven by higher sales and trading revenue. Noninterest
expense decreased $1.4 billion to $10.8 billion due to a reduction
in personnel-related expenses, brokerage, clearing and exchange
fees, and other operating expenses. The income tax expense in
2012 included a $781 million charge for remeasurement of certain
deferred tax assets due to decreases in the U.K. corporate tax
rate compared to a similar charge of $774 million in 2011.
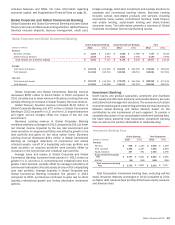
Year-end assets increased $113.4 billion in 2012 to $615.3
billion at December 31, 2012 largely driven by increased client-
facing activity in the equity business as well as increases in trading-
related assets and securities borrowed transactions.
Average economic capital decreased due to a decline in the
risk composition of trading-related balances. The return on average
economic capital increased primarily due to higher net income and
a decline in average economic capital. For more information
regarding economic capital, see Supplemental Financial Data on
page 31.