Bank of America 2012 Annual Report Download - page 92
Download and view the complete annual report
Please find page 92 of the 2012 Bank of America annual report below. You can navigate through the pages in the report by either clicking on the pages listed below, or by using the keyword search tool below to find specific information within the annual report.-
 1
1 -
2
-
3
-
4
-
5
-
6
-
7
-
8
-
9
-
10
-
11
-
12
-
13
-
14
-
15
-
16
-
17
-
18
-
19
-
20
-
21
-
22
-
23
-
24
-
25
-
26
-
27
-
28
-
29
-
30
-
31
-
32
-
33
-
34
-
35
-
36
-
37
-
38
-
39
-
40
-
41
-
42
-
43
-
44
-
45
-
46
-
47
-
48
-
49
-
50
-
51
-
52
-
53
-
54
-
55
-
56
-
57
-
58
-
59
-
60
-
61
-
62
-
63
-
64
-
65
-
66
-
67
-
68
-
69
-
70
-
71
-
72
-
73
-
74
-
75
-
76
-
77
-
78
-
79
-
80
-
81
-
 82
82 -
 83
83 -
 84
84 -
 85
85 -
 86
86 -
 87
87 -
 88
88 -
 89
89 -
 90
90 -
 91
91 -
 92
92 -
 93
93 -
 94
94 -
 95
95 -
 96
96 -
 97
97 -
 98
98 -
 99
99 -
 100
100 -
 101
101 -
 102
102 -
103
-
104
-
105
-
106
-
107
-
108
-
109
-
110
-
111
-
112
-
113
-
114
-
115
-
116
-
117
-
118
-
119
-
120
-
121
-
122
-
123
-
124
-
125
-
126
-
127
-
128
-
129
-
130
-
131
-
132
-
133
-
134
-
135
-
136
-
137
-
138
-
139
-
140
-
141
-
142
-
143
-
144
-
145
-
146
-
147
-
148
-
149
-
150
-
151
-
152
-
153
-
154
-
155
-
156
-
157
-
158
-
159
-
160
-
161
-
162
-
163
-
164
-
165
-
166
-
167
-
168
-
169
-
170
-
171
-
172
-
173
-
174
-
175
-
176
-
177
-
178
-
179
-
180
-
181
-
182
-
183
-
184
-
185
-
186
-
187
-
188
-
189
-
190
-
191
-
192
-
193
-
194
-
195
-
196
-
197
-
198
-
199
-
200
-
201
-
202
-
203
-
204
-
205
-
206
-
207
-
208
-
209
-
210
-
211
-
212
-
213
-
214
-
215
-
216
-
217
-
218
-
219
-
220
-
221
-
222
-
223
-
224
-
225
-
226
-
227
-
228
-
229
-
230
-
231
-
232
-
233
-
234
-
235
-
236
-
237
-
238
-
239
-
240
-
241
-
242
-
243
-
244
-
245
-
246
-
247
-
248
-
249
-
250
-
251
-
252
-
253
-
254
-
255
-
256
-
257
-
258
-
259
-
260
-
261
-
262
-
263
-
264
-
265
-
266
-
267
-
268
-
269
-
270
-
271
-
272
-
273
-
274
-
275
-
276
-
277
-
278
-
279
-
280
-
281
-
282
-
283
-
284
 |
 |

90 Bank of America 2012
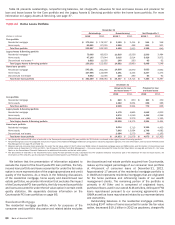
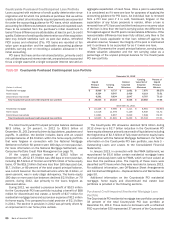
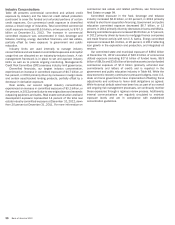
Restructured Loans
Nonperforming loans also include certain loans that have been
modified in TDRs where economic concessions have been granted
to borrowers experiencing financial difficulties. These concessions
typically result from the Corporation’s loss mitigation activities and
could include reductions in the interest rate, payment extensions,
forgiveness of principal, forbearance or other actions. Certain
TDRs are classified as nonperforming at the time of restructuring
and may only be returned to performing status after considering
the borrower’s sustained repayment performance for a reasonable
period, generally six months. Nonperforming TDRs, excluding those
modified loans in the Countrywide PCI loan portfolio, are included
in Table 37.
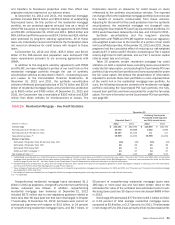
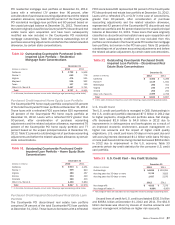
Table 37 Nonperforming Consumer Loans and Foreclosed Properties Activity (1)
(Dollars in millions) 2012 2011
Nonperforming loans, January 1 $ 18,768 $ 20,854
Additions to nonperforming loans:
New nonperforming loans 13,084 15,723
Implementation of change in treatment of loans discharged in bankruptcies (2) 1,162 n/a
Implementation of regulatory interagency guidance (3) 1,853 n/a
Reductions to nonperforming loans:
Paydowns and payoffs (3,801)(3,318)
Sales (47) —
Returns to performing status (4) (4,203)(4,741)
Charge-offs (5) (6,544)(8,095)
Transfers to foreclosed properties (6) (841)(1,655)
Total net additions (reductions) to nonperforming loans 663 (2,086)
Total nonperforming loans, December 31 (7) 19,431 18,768
Foreclosed properties, January 1 (8) 1,991 1,249
Additions to foreclosed properties:
New foreclosed properties (6) 1,129 2,996
Reductions to foreclosed properties:
Sales (2,283)(1,993)
Write-downs (187)(261)
Total net additions (reductions) to foreclosed properties (1,341)742
Total foreclosed properties, December 31 650 1,991
Nonperforming consumer loans and foreclosed properties, December 31 $ 20,081 $ 20,759
Nonperforming consumer loans as a percentage of outstanding consumer loans (9) 3.52%3.09%
Nonperforming consumer loans and foreclosed properties as a percentage of outstanding consumer loans and foreclosed properties (9) 3.63 3.41
(1) Balances do not include nonperforming LHFS of $676 million and $659 million and nonaccruing TDRs removed from the Countrywide PCI portfolio prior to January 1, 2010 of $521 million and $477
million at December 31, 2012 and 2011 as well as loans accruing past due 90 days or more as presented in Table 22 and Note 5 – Outstanding Loans and Leases to the Consolidated Financial
Statements.
(2) In 2012, we added $1.2 billion to nonperforming loans as a result of new regulatory guidance on loans discharged in Chapter 7 bankruptcy. For more information, see Consumer Portfolio Credit Risk
Management on page 76 and Table 21.
(3) As a result of the regulatory interagency guidance, we reclassified $1.9 billion of performing home equity loans to nonperforming during 2012. For more information, see Consumer Portfolio Credit
Risk Management on page 76.
(4) Consumer loans may be returned to performing status when all principal and interest is current and full repayment of the remaining contractual principal and interest is expected, or when the loan
otherwise becomes well-secured and is in the process of collection.
(5) Our policy is to not classify consumer credit card and non-bankruptcy related consumer loans not secured by real estate as nonperforming; therefore, the charge-offs on these loans have no impact
on nonperforming activity and accordingly are excluded from this table.
(6) New foreclosed properties represents transfers of nonperforming loans to foreclosed properties net of charge-offs taken during the first 90 days after transfer of a loan to foreclosed properties. New
foreclosed properties also includes properties obtained upon foreclosure of delinquent PCI loans, properties repurchased due to representations and warranties exposure and properties acquired
with newly consolidated subsidiaries.
(7) At December 31, 2012, 52 percent of nonperforming loans were 180 days or more past due and were written down through charge-offs to 62 percent of the unpaid principal balance.
(8) Foreclosed property balances do not include loans that are insured by the FHA and have entered foreclosure of $2.5 billion and $1.4 billion at December 31, 2012 and 2011.
(9) Outstanding consumer loans exclude loans accounted for under the fair value option.
n/a = not applicable
Our policy is to record any losses in the value of foreclosed
properties as a reduction in the allowance for loan and lease losses
during the first 90 days after transfer of a loan to foreclosed
properties. Thereafter, further losses in value are recorded in
noninterest expense. New foreclosed properties included in Table
37 are net of $261 million and $352 million of charge-offs for
2012 and 2011, recorded during the first 90 days after transfer.
In 2012, new regulatory guidance was issued addressing
secured consumer loans that have been discharged in Chapter 7
bankruptcy, and as a result, $3.6 billion of loans were included in
TDRs at December 31, 2012, of which $1.2 billion were current
or less than 60 days past due upon implementation. Of the $3.6
billion of TDRs, approximately 27 percent, 41 percent and 32
percent had been discharged in Chapter 7 bankruptcy in 2012,
2011 and prior years, respectively. For more information, see
Consumer Portfolio Credit Risk Management on page 76 and Table
21.