Bank of America 2012 Annual Report Download - page 276
Download and view the complete annual report
Please find page 276 of the 2012 Bank of America annual report below. You can navigate through the pages in the report by either clicking on the pages listed below, or by using the keyword search tool below to find specific information within the annual report.-
 1
1 -
2
-
3
-
4
-
5
-
6
-
7
-
8
-
9
-
10
-
11
-
12
-
13
-
14
-
15
-
16
-
17
-
18
-
19
-
20
-
21
-
22
-
23
-
24
-
25
-
26
-
27
-
28
-
29
-
30
-
31
-
32
-
33
-
34
-
35
-
36
-
37
-
38
-
39
-
40
-
41
-
42
-
43
-
44
-
45
-
46
-
47
-
48
-
49
-
50
-
51
-
52
-
53
-
54
-
55
-
56
-
57
-
58
-
59
-
60
-
61
-
62
-
63
-
64
-
65
-
66
-
67
-
68
-
69
-
70
-
71
-
72
-
73
-
74
-
75
-
76
-
77
-
78
-
79
-
80
-
81
-
82
-
83
-
84
-
85
-
86
-
87
-
88
-
89
-
90
-
91
-
92
-
93
-
94
-
95
-
96
-
97
-
98
-
99
-
100
-
101
-
102
-
103
-
104
-
105
-
106
-
107
-
108
-
109
-
110
-
111
-
112
-
113
-
114
-
115
-
116
-
117
-
118
-
119
-
120
-
121
-
122
-
123
-
124
-
125
-
126
-
127
-
128
-
129
-
130
-
131
-
132
-
133
-
134
-
135
-
136
-
137
-
138
-
139
-
140
-
141
-
142
-
143
-
144
-
145
-
146
-
147
-
148
-
149
-
150
-
151
-
152
-
153
-
154
-
155
-
156
-
157
-
158
-
159
-
160
-
161
-
162
-
163
-
164
-
165
-
166
-
167
-
168
-
169
-
170
-
171
-
172
-
173
-
174
-
175
-
176
-
177
-
178
-
179
-
180
-
181
-
182
-
183
-
184
-
185
-
186
-
187
-
188
-
189
-
190
-
191
-
192
-
193
-
194
-
195
-
196
-
197
-
198
-
199
-
200
-
201
-
202
-
203
-
204
-
205
-
206
-
207
-
208
-
209
-
210
-
211
-
212
-
213
-
214
-
215
-
216
-
217
-
218
-
219
-
220
-
221
-
222
-
223
-
224
-
225
-
226
-
227
-
228
-
229
-
230
-
231
-
232
-
233
-
234
-
235
-
236
-
237
-
238
-
239
-
240
-
241
-
242
-
243
-
244
-
245
-
246
-
247
-
248
-
249
-
250
-
251
-
252
-
253
-
254
-
255
-
256
-
257
-
258
-
259
-
260
-
261
-
262
-
263
-
264
-
265
-
 266
266 -
 267
267 -
 268
268 -
 269
269 -
 270
270 -
 271
271 -
 272
272 -
 273
273 -
 274
274 -
 275
275 -
 276
276 -
 277
277 -
 278
278 -
 279
279 -
 280
280 -
 281
281 -
 282
282 -
 283
283 -
 284
284
 |
 |

274 Bank of America 2012
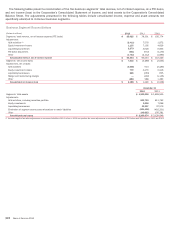
The following tables present a reconciliation of the five business segments’ total revenue, net of interest expense, on a FTE basis,
and net income (loss) to the Corporation’s Consolidated Statement of Income, and total assets to the Corporation’s Consolidated
Balance Sheet. The adjustments presented in the following tables include consolidated income, expense and asset amounts not
specifically allocated to individual business segments.
Business Segment Reconciliations
(Dollars in millions) 2012 2011 2010
Segments’ total revenue, net of interest expense (FTE basis) $ 85,025 $ 78,331 $ 100,774
Adjustments:
ALM activities (1) (2,412)7,576 1,872
Equity investment income 1,135 7,105 4,629
Liquidating businesses 2,279 3,526 6,005
FTE basis adjustment (901) (972) (1,170)
Other (1,792)(2,112) (1,890)
Consolidated revenue, net of interest expense $ 83,334 $ 93,454 $ 110,220
Segments’ net income (loss) $ 7,816 $ (3,266) $ (3,545)
Adjustments, net of taxes:
ALM activities (4,088)513 (2,480)
Equity investment income 715 4,476 2,916
Liquidating businesses 226 (263) 635
Merger and restructuring charges —(402) (1,146)
Other (481) 388 1,382
Consolidated net income (loss) $ 4,188 $ 1,446 $ (2,238)
December 31
2012 2011
Segments’ total assets $1,962,690 $ 1,808,555
Adjustments:
ALM activities, including securities portfolio 622,722 611,793
Equity investments 5,508 7,098
Liquidating businesses 32,597 37,570
Elimination of segment excess asset allocations to match liabilities (554,426)(492,251)
Other 140,883 156,281
Consolidated total assets $ 2,209,974 $ 2,129,046
(1) Includes negative fair value adjustments on structured liabilities of $5.1 billion in 2012 and positive fair value adjustments on structured liabilities of $3.3 billion and $18 million in 2011 and 2010.