Bank of America 2012 Annual Report Download - page 126
Download and view the complete annual report
Please find page 126 of the 2012 Bank of America annual report below. You can navigate through the pages in the report by either clicking on the pages listed below, or by using the keyword search tool below to find specific information within the annual report.-
 1
1 -
2
-
3
-
4
-
5
-
6
-
7
-
8
-
9
-
10
-
11
-
12
-
13
-
14
-
15
-
16
-
17
-
18
-
19
-
20
-
21
-
22
-
23
-
24
-
25
-
26
-
27
-
28
-
29
-
30
-
31
-
32
-
33
-
34
-
35
-
36
-
37
-
38
-
39
-
40
-
41
-
42
-
43
-
44
-
45
-
46
-
47
-
48
-
49
-
50
-
51
-
52
-
53
-
54
-
55
-
56
-
57
-
58
-
59
-
60
-
61
-
62
-
63
-
64
-
65
-
66
-
67
-
68
-
69
-
70
-
71
-
72
-
73
-
74
-
75
-
76
-
77
-
78
-
79
-
80
-
81
-
82
-
83
-
84
-
85
-
86
-
87
-
88
-
89
-
90
-
91
-
92
-
93
-
94
-
95
-
96
-
97
-
98
-
99
-
100
-
101
-
102
-
103
-
104
-
105
-
106
-
107
-
108
-
109
-
110
-
111
-
112
-
113
-
114
-
115
-
 116
116 -
 117
117 -
 118
118 -
 119
119 -
 120
120 -
 121
121 -
 122
122 -
 123
123 -
 124
124 -
 125
125 -
 126
126 -
 127
127 -
 128
128 -
 129
129 -
 130
130 -
 131
131 -
 132
132 -
 133
133 -
 134
134 -
 135
135 -
 136
136 -
137
-
138
-
139
-
140
-
141
-
142
-
143
-
144
-
145
-
146
-
147
-
148
-
149
-
150
-
151
-
152
-
153
-
154
-
155
-
156
-
157
-
158
-
159
-
160
-
161
-
162
-
163
-
164
-
165
-
166
-
167
-
168
-
169
-
170
-
171
-
172
-
173
-
174
-
175
-
176
-
177
-
178
-
179
-
180
-
181
-
182
-
183
-
184
-
185
-
186
-
187
-
188
-
189
-
190
-
191
-
192
-
193
-
194
-
195
-
196
-
197
-
198
-
199
-
200
-
201
-
202
-
203
-
204
-
205
-
206
-
207
-
208
-
209
-
210
-
211
-
212
-
213
-
214
-
215
-
216
-
217
-
218
-
219
-
220
-
221
-
222
-
223
-
224
-
225
-
226
-
227
-
228
-
229
-
230
-
231
-
232
-
233
-
234
-
235
-
236
-
237
-
238
-
239
-
240
-
241
-
242
-
243
-
244
-
245
-
246
-
247
-
248
-
249
-
250
-
251
-
252
-
253
-
254
-
255
-
256
-
257
-
258
-
259
-
260
-
261
-
262
-
263
-
264
-
265
-
266
-
267
-
268
-
269
-
270
-
271
-
272
-
273
-
274
-
275
-
276
-
277
-
278
-
279
-
280
-
281
-
282
-
283
-
284
 |
 |

124 Bank of America 2012
2011 Compared to 2010
The following discussion and analysis provides a comparison of
our results of operations for 2011 and 2010. This discussion
should be read in conjunction with the Consolidated Financial
Statements and related Notes. Tables 7 and 8 contain financial
data to supplement this discussion.
Overview
Net Income (Loss)
Net income was $1.4 billion in 2011 compared to a net loss of
$2.2 billion in 2010. Including preferred stock dividends, the net
income applicable to common shareholders was $85 million, or
$0.01 per diluted share. Those results compared to a net loss
applicable to common shareholders of $3.6 billion, or $0.37 per
diluted share for 2010.
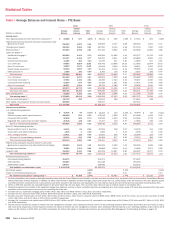
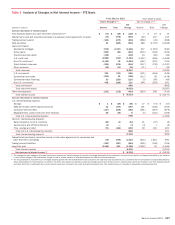
Net Interest Income
Net interest income on a FTE basis was $45.6 billion for 2011, a
decrease of $7.1 billion compared to 2010. The decline was
primarily due to lower consumer loan balances and yields and
decreased investment security yields, including the acceleration
of purchase premium amortization from an increase in modeled
prepayment expectations, and increased hedge ineffectiveness.
Lower trading-related net interest income also negatively impacted
2011 results. These decreases were partially offset by ongoing
reductions in our debt footprint and lower interest rates paid on
deposits. The net interest yield on a FTE basis was 2.48 percent
for 2011, a decrease of 30 bps compared to 2010 as the yield
continued to be under pressure due to the aforementioned items
and the low rate environment.
Noninterest Income
Noninterest income was $48.8 billion in 2011, a decrease of $9.9
billion compared to 2010.
Card income decreased $924 million primarily due to the
implementation of new interchange fee rules under the Durbin
Amendment, which became effective on October 1, 2011 and
the Credit Card Accountability Responsibility and Disclosure Act
of 2009 (CARD Act) provisions that were implemented during
2010.
Service charges decreased $1.3 billion largely due to the impact
of overdraft policy changes in conjunction with Regulation E,
which became effective in the third quarter of 2010.
Equity investment income increased $2.1 billion. The results for
2011 included $6.5 billion of gains on the sale of CCB shares,
partially offset by $1.1 billion of impairment charges on our
merchant services joint venture. The prior year included $2.5
billion of net gains which included the sales of certain strategic
investments, $2.3 billion of gains in our GPI portfolio and $535
million of CCB dividends.
Trading account profits decreased $3.4 billion primarily due to
adverse market conditions and extreme volatility in the credit
markets compared to the prior year. Net DVA gains on derivatives
were $1.0 billion in 2011 compared to $262 million in 2010 as
a result of a widening of our credit spreads. Proprietary trading
revenue was $434 million for the six months ended June 30,
2011 compared to $1.4 billion for 2010 due to Global Markets
exiting its stand-alone proprietary trading business as of June
30, 2011.
Mortgage banking income decreased $11.6 billion primarily due
to an $8.8 billion increase in the representations and warranties
provision which was largely related to the BNY Mellon
Settlement. Also contributing to the decline was lower
production income due to a reduction in new loan origination
volumes partially offset by an increase in servicing income.
Other income increased $4.5 billion primarily due to positive
fair value adjustments of $3.3 billion related to widening of our
own credit spreads on structured liabilities compared to $18
million in 2010. In addition, 2011 included a $771 million gain
on the sale of Balboa as well as $1.2 billion of gains on the
exchange of certain trust preferred securities for common stock
and debt.
Provision for Credit Losses
The provision for credit losses was $13.4 billion for 2011, a
decrease of $15.0 billion compared to 2010. The provision for
credit losses was $7.4 billion lower than net charge-offs for 2011,
resulting in a reduction in the allowance for credit losses primarily
driven by lower delinquencies, improved collection rates and fewer
bankruptcy filings across the U.S. credit card and unsecured
consumer lending portfolios, and improvement in overall credit
quality in the commercial real estate portfolio partially offset by
additions to consumer PCI loan portfolio reserves. This compared
to a $5.9 billion reduction in the allowance for credit losses in
2010.
Net charge-offs totaled $20.8 billion, or 2.24 percent of
average loans and leases for 2011 compared to $34.3 billion, or
3.60 percent for 2010. The decrease in net charge-offs was
primarily driven by improvements in general economic conditions
that resulted in lower delinquencies, improved collection rates and
fewer bankruptcy filings across the U.S. credit card and unsecured
consumer lending portfolios, as well as lower losses in the home
equity portfolio primarily driven by fewer delinquent loans.
Noninterest Expense
Noninterest expense was $80.3 billion for 2011, a decrease of
$2.8 billion compared to 2010. Goodwill impairment charges were
$3.2 billion for 2011 compared to $12.4 billion in the prior year.
Personnel expense increased $1.8 billion for 2011 attributable to
personnel costs related to the continued build-out of certain
businesses, technology costs as well as increases in default-
related servicing. Additionally, professional fees increased $686
million related to consulting fees for regulatory initiatives as well
as higher legal expenses. Other general operating expenses
increased $4.9 billion largely as a result of a $3.0 billion increase
in litigation expense, primarily mortgage-related, and an increase
of $1.6 billion in mortgage-related assessments and waivers
costs. Merger and restructuring expenses decreased $1.2 billion
in 2011.
Income Tax Expense
The income tax benefit was $1.7 billion on the pre-tax loss of $230
million for 2011 compared to income tax expense of $915 million
on the pre-tax loss of $1.3 billion for 2010. These amounts are
before FTE adjustments. The income tax benefit for 2011 was
driven by recurring tax preference items, a $1.0 billion benefit from
the release of the remaining valuation allowance applicable to the
Merrill Lynch capital loss carryover deferred tax asset, and a
benefit of $823 million for planned realization of previously
unrecognized deferred tax assets related to the tax basis in certain