Bank of America 2012 Annual Report Download - page 43
Download and view the complete annual report
Please find page 43 of the 2012 Bank of America annual report below. You can navigate through the pages in the report by either clicking on the pages listed below, or by using the keyword search tool below to find specific information within the annual report.-
 1
1 -
2
-
3
-
4
-
5
-
6
-
7
-
8
-
9
-
10
-
11
-
12
-
13
-
14
-
15
-
16
-
17
-
18
-
19
-
20
-
21
-
22
-
23
-
24
-
25
-
26
-
27
-
28
-
29
-
30
-
31
-
32
-
 33
33 -
 34
34 -
 35
35 -
 36
36 -
 37
37 -
 38
38 -
 39
39 -
 40
40 -
 41
41 -
 42
42 -
 43
43 -
 44
44 -
 45
45 -
 46
46 -
 47
47 -
 48
48 -
 49
49 -
 50
50 -
 51
51 -
 52
52 -
 53
53 -
54
-
55
-
56
-
57
-
58
-
59
-
60
-
61
-
62
-
63
-
64
-
65
-
66
-
67
-
68
-
69
-
70
-
71
-
72
-
73
-
74
-
75
-
76
-
77
-
78
-
79
-
80
-
81
-
82
-
83
-
84
-
85
-
86
-
87
-
88
-
89
-
90
-
91
-
92
-
93
-
94
-
95
-
96
-
97
-
98
-
99
-
100
-
101
-
102
-
103
-
104
-
105
-
106
-
107
-
108
-
109
-
110
-
111
-
112
-
113
-
114
-
115
-
116
-
117
-
118
-
119
-
120
-
121
-
122
-
123
-
124
-
125
-
126
-
127
-
128
-
129
-
130
-
131
-
132
-
133
-
134
-
135
-
136
-
137
-
138
-
139
-
140
-
141
-
142
-
143
-
144
-
145
-
146
-
147
-
148
-
149
-
150
-
151
-
152
-
153
-
154
-
155
-
156
-
157
-
158
-
159
-
160
-
161
-
162
-
163
-
164
-
165
-
166
-
167
-
168
-
169
-
170
-
171
-
172
-
173
-
174
-
175
-
176
-
177
-
178
-
179
-
180
-
181
-
182
-
183
-
184
-
185
-
186
-
187
-
188
-
189
-
190
-
191
-
192
-
193
-
194
-
195
-
196
-
197
-
198
-
199
-
200
-
201
-
202
-
203
-
204
-
205
-
206
-
207
-
208
-
209
-
210
-
211
-
212
-
213
-
214
-
215
-
216
-
217
-
218
-
219
-
220
-
221
-
222
-
223
-
224
-
225
-
226
-
227
-
228
-
229
-
230
-
231
-
232
-
233
-
234
-
235
-
236
-
237
-
238
-
239
-
240
-
241
-
242
-
243
-
244
-
245
-
246
-
247
-
248
-
249
-
250
-
251
-
252
-
253
-
254
-
255
-
256
-
257
-
258
-
259
-
260
-
261
-
262
-
263
-
264
-
265
-
266
-
267
-
268
-
269
-
270
-
271
-
272
-
273
-
274
-
275
-
276
-
277
-
278
-
279
-
280
-
281
-
282
-
283
-
284
 |
 |
Bank of America 2012 41
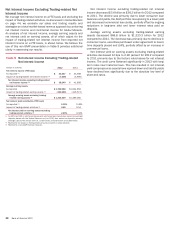
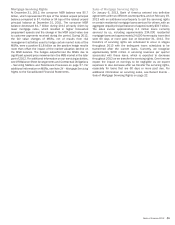
Mortgage Servicing Rights
At December 31, 2012, the consumer MSR balance was $5.7
billion, which represented 55 bps of the related unpaid principal
balance compared to $7.4 billion or 54 bps of the related unpaid
principal balance at December 31, 2011. The consumer MSR
balance decreased $1.7 billion during 2012 primarily driven by
lower mortgage rates, which resulted in higher forecasted
prepayment speeds and the change in the MSR asset value due
to customer payments received during the period. During 2012,
the fair value changes of MSRs, net of results from risk
management activities used to hedge certain market risks of the
MSRs, were a positive $1.8 billion as the positive hedge results
more than offset the impact of the market valuation decline on
the MSR balance. The hedges outperformed the MSRs due to
significant upward price movements in the MBS market in the later
part of 2012. For additional information on our servicing activities,
see Off-Balance Sheet Arrangements and Contractual Obligations
– Servicing Matters and Foreclosure Processes on page 57. For
additional information on MSRs, see Note 24 – Mortgage Servicing
Rights to the Consolidated Financial Statements.
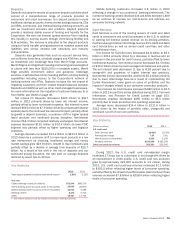
Sales of Mortgage Servicing Rights
On January 6, 2013, Bank of America entered into definitive
agreements with two different counterparties, and on February 19,
2013 with an additional counterparty to sell the servicing rights
on certain residential mortgage loans serviced for others, with an
aggregate unpaid principal balance of approximately $317 billion.
The sales involve approximately 2.1 million loans currently
serviced by us, including approximately 234,000 residential
mortgage loans and approximately 24,000 home equity loans that
were 60 days or more past due at December 31, 2012. The
transfers of servicing rights are scheduled to occur in stages
throughout 2013 with the delinquent loans scheduled to be
transferred after the current loans. Currently, we recognize
approximately $200 million in servicing revenues per quarter
associated with these loans, which is expected to decrease
throughout 2013 as we transfer the servicing rights. Over time we
expect the impact on earnings to be negligible as we expect
expenses to also decrease after we transfer the servicing rights,
especially for loans that are 60 days or more past due. For
additional information on servicing sales, see Recent Events –
Sale of Mortgage Servicing Rights on page 22.