Bank of America 2012 Annual Report Download - page 97
Download and view the complete annual report
Please find page 97 of the 2012 Bank of America annual report below. You can navigate through the pages in the report by either clicking on the pages listed below, or by using the keyword search tool below to find specific information within the annual report.-
 1
1 -
2
-
3
-
4
-
5
-
6
-
7
-
8
-
9
-
10
-
11
-
12
-
13
-
14
-
15
-
16
-
17
-
18
-
19
-
20
-
21
-
22
-
23
-
24
-
25
-
26
-
27
-
28
-
29
-
30
-
31
-
32
-
33
-
34
-
35
-
36
-
37
-
38
-
39
-
40
-
41
-
42
-
43
-
44
-
45
-
46
-
47
-
48
-
49
-
50
-
51
-
52
-
53
-
54
-
55
-
56
-
57
-
58
-
59
-
60
-
61
-
62
-
63
-
64
-
65
-
66
-
67
-
68
-
69
-
70
-
71
-
72
-
73
-
74
-
75
-
76
-
77
-
78
-
79
-
80
-
81
-
82
-
83
-
84
-
85
-
86
-
 87
87 -
 88
88 -
 89
89 -
 90
90 -
 91
91 -
 92
92 -
 93
93 -
 94
94 -
 95
95 -
 96
96 -
 97
97 -
 98
98 -
 99
99 -
 100
100 -
 101
101 -
 102
102 -
 103
103 -
 104
104 -
 105
105 -
 106
106 -
 107
107 -
108
-
109
-
110
-
111
-
112
-
113
-
114
-
115
-
116
-
117
-
118
-
119
-
120
-
121
-
122
-
123
-
124
-
125
-
126
-
127
-
128
-
129
-
130
-
131
-
132
-
133
-
134
-
135
-
136
-
137
-
138
-
139
-
140
-
141
-
142
-
143
-
144
-
145
-
146
-
147
-
148
-
149
-
150
-
151
-
152
-
153
-
154
-
155
-
156
-
157
-
158
-
159
-
160
-
161
-
162
-
163
-
164
-
165
-
166
-
167
-
168
-
169
-
170
-
171
-
172
-
173
-
174
-
175
-
176
-
177
-
178
-
179
-
180
-
181
-
182
-
183
-
184
-
185
-
186
-
187
-
188
-
189
-
190
-
191
-
192
-
193
-
194
-
195
-
196
-
197
-
198
-
199
-
200
-
201
-
202
-
203
-
204
-
205
-
206
-
207
-
208
-
209
-
210
-
211
-
212
-
213
-
214
-
215
-
216
-
217
-
218
-
219
-
220
-
221
-
222
-
223
-
224
-
225
-
226
-
227
-
228
-
229
-
230
-
231
-
232
-
233
-
234
-
235
-
236
-
237
-
238
-
239
-
240
-
241
-
242
-
243
-
244
-
245
-
246
-
247
-
248
-
249
-
250
-
251
-
252
-
253
-
254
-
255
-
256
-
257
-
258
-
259
-
260
-
261
-
262
-
263
-
264
-
265
-
266
-
267
-
268
-
269
-
270
-
271
-
272
-
273
-
274
-
275
-
276
-
277
-
278
-
279
-
280
-
281
-
282
-
283
-
284
 |
 |

Bank of America 2012 95
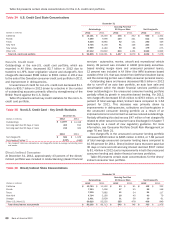
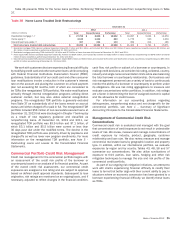
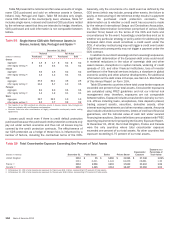
Tables 44 and 45 present commercial real estate credit quality
data by non-residential and residential property types. The
residential portfolio presented in Tables 43, 44 and 45 includes
condominiums and other residential real estate. Other property
types in Tables 43, 44 and 45 primarily include special purpose,
nursing/retirement homes, medical facilities and restaurants, as
well as unsecured loans to borrowers whose primary business is
commercial real estate.
Table 44 Commercial Real Estate Credit Quality Data
December 31
Nonperforming Loans and
Foreclosed Properties (1)
Utilized Reservable
Criticized Exposure (2)
(Dollars in millions) 2012 2011 2012 2011
Non-residential
Office $295 $ 807 $914 $ 2,375
Multi-family rental 109 339 375 1,604
Shopping centers/retail 230 561 464 1,378
Industrial/warehouse 160 521 324 1,317
Hotels/motels 45 173 202 716
Multi-use 123 345 309 971
Land and land development 321 530 359 749
Other 87 223 301 997
Total non-residential 1,370 3,499 3,248 10,107
Residential 393 993 534 1,418
Total commercial real estate $ 1,763 $ 4,492 $ 3,782 $ 11,525
(1) Includes commercial foreclosed properties of $250 million and $612 million at December 31, 2012 and 2011.
(2) Includes loans, SBLCs and bankers’ acceptances and excludes loans accounted for under the fair value option.
Table 45 Commercial Real Estate Net Charge-offs and Related Ratios
Net Charge-offs Net Charge-off Ratios (1)
(Dollars in millions) 2012 2011 2012 2011
Non-residential
Office $106 $ 126 1.36%1.51%
Multi-family rental 13 36 0.23 0.52
Shopping centers/retail 57 184 1.00 2.69
Industrial/warehouse 49 88 1.31 1.94
Hotels/motels 11 23 0.39 0.86
Multi-use 66 61 2.46 1.63
Land and land development (23) 152 (1.73) 7.58
Other 31 19 0.51 0.33
Total non-residential 310 689 0.86 1.67
Residential 74 258 3.74 8.00
Total commercial real estate $ 384 $ 947 1.01 2.13
(1) Net charge-off ratios are calculated as net charge-offs divided by average outstanding loans excluding loans accounted for under the fair value option.
At December 31, 2012, total committed non-residential
exposure was $54.5 billion compared to $53.1 billion at
December 31, 2011, of which $37.0 billion and $37.2 billion were
funded secured loans. Non-residential nonperforming loans and
foreclosed properties were $1.4 billion and $3.5 billion at
December 31, 2012 and 2011, which represented 3.68 percent
and 9.29 percent of total non-residential loans and foreclosed
properties. The decline in nonperforming loans and foreclosed
properties in the non-residential portfolio was driven by decreases
in the office, industrial/warehouse, shopping centers/retail and
multi-family rental property types. Non-residential utilized
reservable criticized exposure decreased to $3.2 billion, or 8.27
percent of non-residential utilized reservable exposure, at
December 31, 2012 compared to $10.1 billion, or 25.34 percent,
at December 31, 2011 primarily driven by repayments and an
overall improvement in credit quality. The decrease in reservable
criticized exposure was primarily driven by office, multi-family
rental, industrial/warehouse and shopping centers/retail property
types in the non-residential portfolio. For the non-residential
portfolio, net charge-offs decreased $379 million in 2012
compared to 2011 primarily due to improving appraisal values,
improved borrower credit profiles and higher recoveries.
At December 31, 2012, total committed residential exposure
was $3.2 billion compared to $3.9 billion at December 31, 2011,
of which $1.6 billion and $2.4 billion were funded secured loans.
The decline in residential committed exposure was due to
repayments, net charge-offs, and continued risk reduction and
mitigation initiatives in line with our portfolio strategy. Residential
nonperforming loans and foreclosed properties decreased $600
million in 2012 due to repayments, a decline in the volume of
loans being downgraded to nonaccrual status and net charge-offs.
Residential utilized reservable criticized exposure decreased
$884 million to $534 million due to repayments and net charge-
offs. The nonperforming loans, leases and foreclosed properties
and the utilized reservable criticized ratios for the residential
portfolio were 23.33 percent and 31.56 percent at December 31,
2012 compared to 38.89 percent and 54.65 percent at
December 31, 2011. Net charge-offs for the residential portfolio
decreased $184 million in 2012 compared to 2011.