Bank of America 2012 Annual Report Download - page 38
Download and view the complete annual report
Please find page 38 of the 2012 Bank of America annual report below. You can navigate through the pages in the report by either clicking on the pages listed below, or by using the keyword search tool below to find specific information within the annual report.-
 1
1 -
2
-
3
-
4
-
5
-
6
-
7
-
8
-
9
-
10
-
11
-
12
-
13
-
14
-
15
-
16
-
17
-
18
-
19
-
20
-
21
-
22
-
23
-
24
-
25
-
26
-
27
-
 28
28 -
 29
29 -
 30
30 -
 31
31 -
 32
32 -
 33
33 -
 34
34 -
 35
35 -
 36
36 -
 37
37 -
 38
38 -
 39
39 -
 40
40 -
 41
41 -
 42
42 -
 43
43 -
 44
44 -
 45
45 -
 46
46 -
 47
47 -
 48
48 -
49
-
50
-
51
-
52
-
53
-
54
-
55
-
56
-
57
-
58
-
59
-
60
-
61
-
62
-
63
-
64
-
65
-
66
-
67
-
68
-
69
-
70
-
71
-
72
-
73
-
74
-
75
-
76
-
77
-
78
-
79
-
80
-
81
-
82
-
83
-
84
-
85
-
86
-
87
-
88
-
89
-
90
-
91
-
92
-
93
-
94
-
95
-
96
-
97
-
98
-
99
-
100
-
101
-
102
-
103
-
104
-
105
-
106
-
107
-
108
-
109
-
110
-
111
-
112
-
113
-
114
-
115
-
116
-
117
-
118
-
119
-
120
-
121
-
122
-
123
-
124
-
125
-
126
-
127
-
128
-
129
-
130
-
131
-
132
-
133
-
134
-
135
-
136
-
137
-
138
-
139
-
140
-
141
-
142
-
143
-
144
-
145
-
146
-
147
-
148
-
149
-
150
-
151
-
152
-
153
-
154
-
155
-
156
-
157
-
158
-
159
-
160
-
161
-
162
-
163
-
164
-
165
-
166
-
167
-
168
-
169
-
170
-
171
-
172
-
173
-
174
-
175
-
176
-
177
-
178
-
179
-
180
-
181
-
182
-
183
-
184
-
185
-
186
-
187
-
188
-
189
-
190
-
191
-
192
-
193
-
194
-
195
-
196
-
197
-
198
-
199
-
200
-
201
-
202
-
203
-
204
-
205
-
206
-
207
-
208
-
209
-
210
-
211
-
212
-
213
-
214
-
215
-
216
-
217
-
218
-
219
-
220
-
221
-
222
-
223
-
224
-
225
-
226
-
227
-
228
-
229
-
230
-
231
-
232
-
233
-
234
-
235
-
236
-
237
-
238
-
239
-
240
-
241
-
242
-
243
-
244
-
245
-
246
-
247
-
248
-
249
-
250
-
251
-
252
-
253
-
254
-
255
-
256
-
257
-
258
-
259
-
260
-
261
-
262
-
263
-
264
-
265
-
266
-
267
-
268
-
269
-
270
-
271
-
272
-
273
-
274
-
275
-
276
-
277
-
278
-
279
-
280
-
281
-
282
-
283
-
284
 |
 |
36 Bank of America 2012
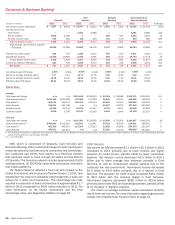
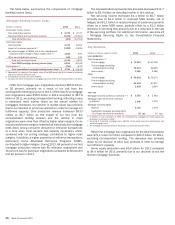
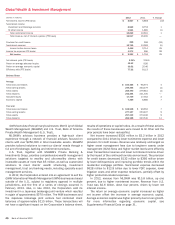
Business Banking
Business Banking provides a wide range of lending-related
products and services, integrated working capital management
and treasury solutions to clients through our network of offices
and client relationship teams along with various product partners.
Our clients include U.S.-based companies generally with annual
sales of $1 million to $50 million. Our lending products and
services include commercial loans, lines of credit and real estate
lending. Our capital management and treasury solutions include
treasury management, foreign exchange and short-term investing
options. Business Banking also includes the results of our
merchant services joint venture.
Net income for Business Banking decreased $76 million to
$343 million in 2012 primarily driven by lower revenue and an
increase in the provision for credit losses, largely offset by lower
noninterest expense. Net interest income decreased $183 million
to $1.2 billion driven by lower average loan balances. Noninterest
income decreased $172 million to $492 million primarily due to
the transfer of certain processing activities to our merchant
services joint venture in 2012. The provision for credit losses
increased $36 million to $281 million primarily driven by a slower
pace of improvement in credit quality than in the prior year.
Noninterest expense decreased $270 million to $888 million
driven by lower FDIC and merchant processing expenses.
Average loans decreased $3.1 billion to $23.8 billion in 2012
primarily driven by the net transfer of certain loans to other
businesses, higher prepayments and continued run-off of non-core
portfolios. Average deposits increased $2.2 billion to $42.8 billion
in 2012 due to the current client preference for liquidity and the
net transfer of certain deposits from other businesses.