Bank of America 2012 Annual Report Download - page 122
Download and view the complete annual report
Please find page 122 of the 2012 Bank of America annual report below. You can navigate through the pages in the report by either clicking on the pages listed below, or by using the keyword search tool below to find specific information within the annual report.-
 1
1 -
2
-
3
-
4
-
5
-
6
-
7
-
8
-
9
-
10
-
11
-
12
-
13
-
14
-
15
-
16
-
17
-
18
-
19
-
20
-
21
-
22
-
23
-
24
-
25
-
26
-
27
-
28
-
29
-
30
-
31
-
32
-
33
-
34
-
35
-
36
-
37
-
38
-
39
-
40
-
41
-
42
-
43
-
44
-
45
-
46
-
47
-
48
-
49
-
50
-
51
-
52
-
53
-
54
-
55
-
56
-
57
-
58
-
59
-
60
-
61
-
62
-
63
-
64
-
65
-
66
-
67
-
68
-
69
-
70
-
71
-
72
-
73
-
74
-
75
-
76
-
77
-
78
-
79
-
80
-
81
-
82
-
83
-
84
-
85
-
86
-
87
-
88
-
89
-
90
-
91
-
92
-
93
-
94
-
95
-
96
-
97
-
98
-
99
-
100
-
101
-
102
-
103
-
104
-
105
-
106
-
107
-
108
-
109
-
110
-
111
-
 112
112 -
 113
113 -
 114
114 -
 115
115 -
 116
116 -
 117
117 -
 118
118 -
 119
119 -
 120
120 -
 121
121 -
 122
122 -
 123
123 -
 124
124 -
 125
125 -
 126
126 -
 127
127 -
 128
128 -
 129
129 -
 130
130 -
 131
131 -
 132
132 -
133
-
134
-
135
-
136
-
137
-
138
-
139
-
140
-
141
-
142
-
143
-
144
-
145
-
146
-
147
-
148
-
149
-
150
-
151
-
152
-
153
-
154
-
155
-
156
-
157
-
158
-
159
-
160
-
161
-
162
-
163
-
164
-
165
-
166
-
167
-
168
-
169
-
170
-
171
-
172
-
173
-
174
-
175
-
176
-
177
-
178
-
179
-
180
-
181
-
182
-
183
-
184
-
185
-
186
-
187
-
188
-
189
-
190
-
191
-
192
-
193
-
194
-
195
-
196
-
197
-
198
-
199
-
200
-
201
-
202
-
203
-
204
-
205
-
206
-
207
-
208
-
209
-
210
-
211
-
212
-
213
-
214
-
215
-
216
-
217
-
218
-
219
-
220
-
221
-
222
-
223
-
224
-
225
-
226
-
227
-
228
-
229
-
230
-
231
-
232
-
233
-
234
-
235
-
236
-
237
-
238
-
239
-
240
-
241
-
242
-
243
-
244
-
245
-
246
-
247
-
248
-
249
-
250
-
251
-
252
-
253
-
254
-
255
-
256
-
257
-
258
-
259
-
260
-
261
-
262
-
263
-
264
-
265
-
266
-
267
-
268
-
269
-
270
-
271
-
272
-
273
-
274
-
275
-
276
-
277
-
278
-
279
-
280
-
281
-
282
-
283
-
284
 |
 |

120 Bank of America 2012
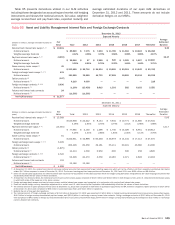
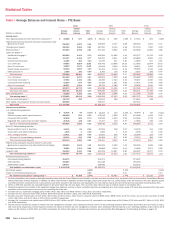
Table 66 Level 3 Asset and Liability Summary
December 31, 2012 December 31, 2011
(Dollars in millions)
Level 3
Fair Value
As a %
of Total
Level 3
Assets
As a %
of Total
Assets
Level 3
Fair Value
As a %
of Total
Level 3
Assets
As a %
of Total
Assets
Trading account assets $ 9,559 26.13% 0.43%$ 11,455 22.21% 0.54%
Derivative assets 8,073 22.06 0.37 14,366 27.85 0.67
AFS debt securities 5,091 13.91 0.23 8,012 15.53 0.38
All other Level 3 assets at fair value 13,865 37.90 0.63 17,744 34.41 0.83
Total Level 3 assets at fair value (1) $ 36,588 100.00% 1.66%$ 51,577 100.00% 2.42%
Level 3
Fair Value
As a %
of Total
Level 3
Liabilities
As a %
of Total
Liabilities
Level 3
Fair Value
As a %
of Total
Level 3
Liabilities
As a %
of Total
Liabilities
Derivative liabilities $ 6,605 73.51% 0.33%$ 8,500 73.46% 0.45%
Long-term debt 2,301 25.61 0.12 2,943 25.43 0.15
All other Level 3 liabilities at fair value 79 0.88 0.01 128 1.11 0.01
Total Level 3 liabilities at fair value (1) $ 8,985 100.00% 0.46%$ 11,571 100.00% 0.61%
(1) Level 3 total assets and liabilities are shown before the impact of counterparty netting related to our derivative positions.
During 2012, we recognized net gains of $136 million on Level
3 assets and liabilities. The net gains were primarily gains on
trading account assets, LHFS, and loans and leases, offset by
losses on MSRs, long-term debt and net derivative assets.
Unrealized gains on trading account assets were primarily due to
mark-to-market gains on collateralized loan obligation positions
due to strong market conditions, as well as mark-to-market gains
on secondary loan positions held in inventory. Unrealized gains on
LHFS were due to improved market conditions for mortgage whole
loans in EMEA. Unrealized gains on loans and leases were due to
an overall improvement in housing prices and lower loss severity.
Unrealized losses on MSRs were primarily due to the impact of
the decline in interest rates on forecasted prepayments.
Unrealized losses on long-term debt were the result of improved
credit spreads throughout the year. Losses on net derivative assets
were primarily due to tightening spreads on credit derivatives and
in the RMBS indices, as well as mark-to-market movement in
various equity instruments, offset by mortgage production gains.
There were net unrealized gains of $65 million in accumulated OCI
on Level 3 assets and liabilities at December 31, 2012. For
additional information on the components of net realized and
unrealized gains and losses during 2012, see Note 21 – Fair Value
Measurements to the Consolidated Financial Statements.
Level 3 financial instruments, such as our consumer MSRs,
may be hedged with derivatives classified as Level 1 or 2; therefore,
gains or losses associated with Level 3 financial instruments may
be offset by gains or losses associated with financial instruments
classified in other levels of the fair value hierarchy. The Level 3
gains and losses recorded in earnings did not have a significant
impact on our liquidity or capital resources.
We conduct a review of our fair value hierarchy classifications
on a quarterly basis. Transfers into or out of Level 3 are made if
the significant inputs used in the financial models measuring the
fair values of the assets and liabilities became unobservable or
observable, respectively, in the current marketplace. These
transfers are considered to be effective as of the beginning of the
quarter in which they occur. For additional information on the
significant transfers into and out of Level 3 during 2012, see Note
21 – Fair Value Measurements to the Consolidated Financial
Statements.
Global Principal Investments
GPI is included within Equity Investments in All Other on page 48.
GPI is comprised of a diversified portfolio of private equity, real
estate and other alternative investments in both privately-held and
publicly-traded companies. These investments are made either
directly in a company or held through a fund. At December 31,
2012, this portfolio totaled $3.5 billion including $2.2 billion of
non-public investments.
Certain equity investments in the portfolio are subject to
investment company accounting under applicable accounting
guidance, and accordingly, are carried at fair value with changes
in fair value reported in equity investment income. Initially the
transaction price of the investment is generally considered to be
the best indicator of fair value. Thereafter, valuation of direct
investments is based on an assessment of each individual
investment using methodologies that include publicly-traded
comparables derived by multiplying a key performance metric (e.g.,
earnings before interest, taxes, depreciation and amortization) of
the portfolio company by the relevant valuation multiple observed
for comparable companies, acquisition comparables, entry-level
multiples and discounted cash flows, and are subject to
appropriate discounts for lack of liquidity or marketability. Certain
factors that may influence changes in fair value include but are
not limited to, recapitalizations, subsequent rounds of financing
and offerings in the equity or debt capital markets. For fund
investments, we generally record the fair value of our proportionate
interest in the fund’s capital as reported by the fund’s respective
managers.
Accrued Income Taxes and Deferred Tax Assets
Accrued income taxes, reported as a component of accrued
expenses and other liabilities on the Corporation’s Consolidated
Balance Sheet, represent the net amount of current income taxes
we expect to pay to or receive from various taxing jurisdictions
attributable to our operations to date. We currently file income tax
returns in more than 100 jurisdictions and consider many factors,
including statutory, judicial and regulatory guidance, in estimating
the appropriate accrued income taxes for each jurisdiction.