Bank of America 2012 Annual Report Download - page 115
Download and view the complete annual report
Please find page 115 of the 2012 Bank of America annual report below. You can navigate through the pages in the report by either clicking on the pages listed below, or by using the keyword search tool below to find specific information within the annual report.-
 1
1 -
2
-
3
-
4
-
5
-
6
-
7
-
8
-
9
-
10
-
11
-
12
-
13
-
14
-
15
-
16
-
17
-
18
-
19
-
20
-
21
-
22
-
23
-
24
-
25
-
26
-
27
-
28
-
29
-
30
-
31
-
32
-
33
-
34
-
35
-
36
-
37
-
38
-
39
-
40
-
41
-
42
-
43
-
44
-
45
-
46
-
47
-
48
-
49
-
50
-
51
-
52
-
53
-
54
-
55
-
56
-
57
-
58
-
59
-
60
-
61
-
62
-
63
-
64
-
65
-
66
-
67
-
68
-
69
-
70
-
71
-
72
-
73
-
74
-
75
-
76
-
77
-
78
-
79
-
80
-
81
-
82
-
83
-
84
-
85
-
86
-
87
-
88
-
89
-
90
-
91
-
92
-
93
-
94
-
95
-
96
-
97
-
98
-
99
-
100
-
101
-
102
-
103
-
104
-
 105
105 -
 106
106 -
 107
107 -
 108
108 -
 109
109 -
 110
110 -
 111
111 -
 112
112 -
 113
113 -
 114
114 -
 115
115 -
 116
116 -
 117
117 -
 118
118 -
 119
119 -
 120
120 -
 121
121 -
 122
122 -
 123
123 -
 124
124 -
 125
125 -
126
-
127
-
128
-
129
-
130
-
131
-
132
-
133
-
134
-
135
-
136
-
137
-
138
-
139
-
140
-
141
-
142
-
143
-
144
-
145
-
146
-
147
-
148
-
149
-
150
-
151
-
152
-
153
-
154
-
155
-
156
-
157
-
158
-
159
-
160
-
161
-
162
-
163
-
164
-
165
-
166
-
167
-
168
-
169
-
170
-
171
-
172
-
173
-
174
-
175
-
176
-
177
-
178
-
179
-
180
-
181
-
182
-
183
-
184
-
185
-
186
-
187
-
188
-
189
-
190
-
191
-
192
-
193
-
194
-
195
-
196
-
197
-
198
-
199
-
200
-
201
-
202
-
203
-
204
-
205
-
206
-
207
-
208
-
209
-
210
-
211
-
212
-
213
-
214
-
215
-
216
-
217
-
218
-
219
-
220
-
221
-
222
-
223
-
224
-
225
-
226
-
227
-
228
-
229
-
230
-
231
-
232
-
233
-
234
-
235
-
236
-
237
-
238
-
239
-
240
-
241
-
242
-
243
-
244
-
245
-
246
-
247
-
248
-
249
-
250
-
251
-
252
-
253
-
254
-
255
-
256
-
257
-
258
-
259
-
260
-
261
-
262
-
263
-
264
-
265
-
266
-
267
-
268
-
269
-
270
-
271
-
272
-
273
-
274
-
275
-
276
-
277
-
278
-
279
-
280
-
281
-
282
-
283
-
284
 |
 |

Bank of America 2012 113
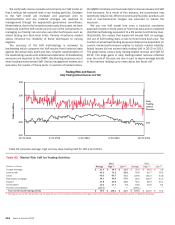
The $92 million decrease in average VaR during 2012 was
driven by reduced risk across most asset classes, with the largest
reductions coming from the credit, real estate/mortgage and
equities asset classes. In addition, volatile market data from 2008,
which was a material contribution to the 2011 average, was no
longer included in the three-year historical dataset for the 2012
average.
Counterparty credit risk is an adjustment to the mark-to-market
value of our derivative exposures to reflect the impact of the credit
quality of counterparties on our derivative assets. Since
counterparty credit exposure is not included in the VaR component
of the regulatory capital allocation, we do not include it in our
trading VaR, and it is therefore not included in the daily trading-
related revenue illustrated in our histogram or used for
backtesting.
Trading Portfolio Stress Testing
Because the very nature of a VaR model suggests results can
exceed our estimates and it is dependent on a limited lookback
window, we also stress test our portfolio. Stress testing estimates
the value change in our trading portfolio that may result from
abnormal market movements. Various scenarios, categorized as
either historical or hypothetical, are regularly run and reported for
the overall trading portfolio and individual businesses. Historical
scenarios simulate the impact of price changes that occurred
during a set of extended historical market events. Generally, a 10-
business-day window or longer, representing the most severe point
during a crisis, is selected for each historical scenario.
Hypothetical scenarios provide simulations of anticipated shocks
from pre-defined market stress events. These stress events
include shocks to underlying market risk variables which may be
well beyond the shocks found in the historical data used to
calculate VaR. As with the historical scenarios, the hypothetical
scenarios are designed to represent a short-term market
disruption. Scenarios are reviewed and updated as necessary in
light of changing positions and new economic or political
information. For example, we currently include stress tests that
contemplate a full or partial break-up of the Eurozone. In addition
to the value afforded by the results themselves, this information
provides senior management with a clear picture of the trend of
risk being taken given the relatively static nature of the shocks
applied. Stress testing for the trading portfolio is also integrated
with enterprise-wide stress testing and incorporated into the limits
framework. A process is in place to promote consistency between
the scenarios used for the trading portfolio and those used for
enterprise-wide stress testing. The scenarios used for enterprise-
wide stress testing purposes differ from the typical trading portfolio
scenarios in that they have a longer time horizon and the results
are forecasted over multiple periods for use in consolidated capital
and liquidity planning. For additional information on enterprise-
wide stress testing, see page 64.
Interest Rate Risk Management for Nontrading
Activities
The following discussion presents net interest income excluding
the impact of trading-related activities.
Interest rate risk represents the most significant market risk
exposure to our nontrading balance sheet. Interest rate risk is
measured as the potential volatility in net interest income caused
by changes in market interest rates. Client-facing activities,
primarily lending and deposit-taking, create interest rate sensitive
positions on our balance sheet.
We prepare forward-looking forecasts of net interest income.
The baseline forecast takes into consideration expected future
business growth, ALM positioning and the direction of interest rate
movements as implied by the market-based forward curve. We
then measure and evaluate the impact that alternative interest
rate scenarios have on the baseline forecast in order to assess
interest rate sensitivity under varied conditions. The net interest
income forecast is frequently updated for changing assumptions
and differing outlooks based on economic trends, market
conditions and business strategies. Thus, we continually monitor
our balance sheet position in an effort to maintain an acceptable
level of exposure to interest rate changes.
The interest rate scenarios that we analyze incorporate balance
sheet assumptions such as loan and deposit growth and pricing,
changes in funding mix, product repricing and maturity
characteristics, but do not include the impact of hedge
ineffectiveness. Our overall goal is to manage interest rate risk so
that movements in interest rates do not significantly adversely
affect core net interest income and capital.
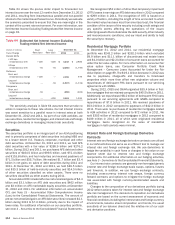
The spot and 12-month forward rates used in our baseline
forecast at December 31, 2012 and 2011 are presented in Table
63.
Table 63 Forward Rates
December 31, 2012
Federal
Funds
Three-
Month
LIBOR
10-Year
Swap
Spot rates 0.25% 0.31% 1.84%
12-month forward rates 0.25 0.37 2.10
December 31, 2011
Spot rates 0.25% 0.58% 2.03%
12-month forward rates 0.25 0.75 2.29