Bank of America 2012 Annual Report Download - page 191
Download and view the complete annual report
Please find page 191 of the 2012 Bank of America annual report below. You can navigate through the pages in the report by either clicking on the pages listed below, or by using the keyword search tool below to find specific information within the annual report.-
 1
1 -
2
-
3
-
4
-
5
-
6
-
7
-
8
-
9
-
10
-
11
-
12
-
13
-
14
-
15
-
16
-
17
-
18
-
19
-
20
-
21
-
22
-
23
-
24
-
25
-
26
-
27
-
28
-
29
-
30
-
31
-
32
-
33
-
34
-
35
-
36
-
37
-
38
-
39
-
40
-
41
-
42
-
43
-
44
-
45
-
46
-
47
-
48
-
49
-
50
-
51
-
52
-
53
-
54
-
55
-
56
-
57
-
58
-
59
-
60
-
61
-
62
-
63
-
64
-
65
-
66
-
67
-
68
-
69
-
70
-
71
-
72
-
73
-
74
-
75
-
76
-
77
-
78
-
79
-
80
-
81
-
82
-
83
-
84
-
85
-
86
-
87
-
88
-
89
-
90
-
91
-
92
-
93
-
94
-
95
-
96
-
97
-
98
-
99
-
100
-
101
-
102
-
103
-
104
-
105
-
106
-
107
-
108
-
109
-
110
-
111
-
112
-
113
-
114
-
115
-
116
-
117
-
118
-
119
-
120
-
121
-
122
-
123
-
124
-
125
-
126
-
127
-
128
-
129
-
130
-
131
-
132
-
133
-
134
-
135
-
136
-
137
-
138
-
139
-
140
-
141
-
142
-
143
-
144
-
145
-
146
-
147
-
148
-
149
-
150
-
151
-
152
-
153
-
154
-
155
-
156
-
157
-
158
-
159
-
160
-
161
-
162
-
163
-
164
-
165
-
166
-
167
-
168
-
169
-
170
-
171
-
172
-
173
-
174
-
175
-
176
-
177
-
178
-
179
-
180
-
 181
181 -
 182
182 -
 183
183 -
 184
184 -
 185
185 -
 186
186 -
 187
187 -
 188
188 -
 189
189 -
 190
190 -
 191
191 -
 192
192 -
 193
193 -
 194
194 -
 195
195 -
 196
196 -
 197
197 -
 198
198 -
 199
199 -
 200
200 -
 201
201 -
202
-
203
-
204
-
205
-
206
-
207
-
208
-
209
-
210
-
211
-
212
-
213
-
214
-
215
-
216
-
217
-
218
-
219
-
220
-
221
-
222
-
223
-
224
-
225
-
226
-
227
-
228
-
229
-
230
-
231
-
232
-
233
-
234
-
235
-
236
-
237
-
238
-
239
-
240
-
241
-
242
-
243
-
244
-
245
-
246
-
247
-
248
-
249
-
250
-
251
-
252
-
253
-
254
-
255
-
256
-
257
-
258
-
259
-
260
-
261
-
262
-
263
-
264
-
265
-
266
-
267
-
268
-
269
-
270
-
271
-
272
-
273
-
274
-
275
-
276
-
277
-
278
-
279
-
280
-
281
-
282
-
283
-
284
 |
 |

Bank of America 2012 189
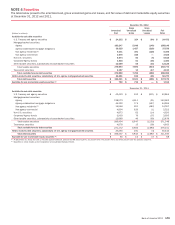
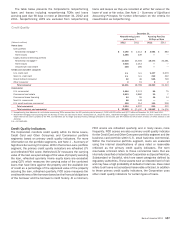
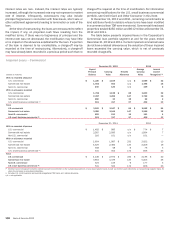
Home Loans – Credit Quality Indicators (1)
December 31, 2011
(Dollars in millions)
Core Portfolio
Residential
Mortgage (2)
Legacy Assets
& Servicing
Residential
Mortgage (2)
Countrywide
Residential
Mortgage PCI
Core Portfolio
Home Equity (2)
Legacy Assets
& Servicing
Home Equity (2)
Countrywide
Hone Equity
PCI
Legacy Assets
& Servicing
Discontinued
Real Estate (2)
Countrywide
Discontinued
Real Estate
PCI
Refreshed LTV (3)
Less than 90 percent $ 80,032 $ 20,450 $ 3,821 $ 46,646 $ 17,354 $ 2,253 $ 895 $5,953
Greater than 90 percent but less than
100 percent 11,838 5,847 1,468 6,988 4,995 1,077 122 1,191
Greater than 100 percent 17,673 22,630 4,677 13,421 23,317 8,648 221 2,713
Fully-insured loans (4) 68,794 25,060 — — — — — —
Total home loans $ 178,337 $ 73,987 $ 9,966 $ 67,055 $ 45,666 $ 11,978 $ 1,238 $ 9,857
Refreshed FICO score (5)
Less than 620 $ 7,020 $ 17,337 $ 3,924 $ 2,843 $ 7,293 $ 4,140 $ 548 $6,275
Greater than or equal to 620 and less than 680 9,331 6,537 1,381 4,704 6,866 1,969 175 1,279
Greater than or equal to 680 and less than 740 26,569 9,439 2,036 13,561 11,798 2,538 228 1,223
Greater than or equal to 740 66,623 15,614 2,625 45,947 19,709 3,331 287 1,080
Fully-insured loans (4) 68,794 25,060 — — — — — —
Total home loans $ 178,337 $ 73,987 $ 9,966 $ 67,055 $ 45,666 $ 11,978 $ 1,238 $ 9,857
(1) Excludes $2.2 billion of loans accounted for under the fair value option.
(2) Excludes Countrywide PCI loans.
(3) Refreshed LTV percentages for PCI loans are calculated using the carrying value net of the related valuation allowance.
(4) Credit quality indicators are not reported for fully-insured loans as principal repayment is insured.
(5) During 2012, refreshed home equity FICO metrics reflected an updated scoring model that is more representative of the credit risk of the Corporation’s borrowers. Prior period amounts were adjusted
to reflect these updates.
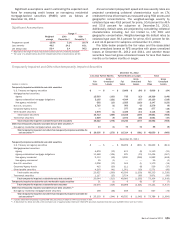
Credit Card and Other Consumer – Credit Quality Indicators
December 31, 2011
(Dollars in millions)
U.S. Credit
Card
Non-U.S.
Credit Card
Direct/Indirect
Consumer
Other
Consumer (1)
Refreshed FICO score
Less than 620 $ 8,172 $ — $ 3,325 $ 802
Greater than or equal to 620 and less than 680 15,474 — 4,665 348
Greater than or equal to 680 and less than 740 39,525 — 12,351 262
Greater than or equal to 740 39,120 — 29,965 244
Other internal credit metrics (2, 3, 4) — 14,418 39,407 1,032
Total credit card and other consumer $ 102,291 $ 14,418 $ 89,713 $2,688
(1) 96 percent of the other consumer portfolio is associated with portfolios from certain consumer finance businesses that the Corporation previously exited.
(2) Other internal credit metrics may include delinquency status, geography or other factors.
(3) Direct/indirect consumer includes $31.1 billion of securities-based lending which is overcollateralized and therefore has minimal credit risk and $6.0 billion of loans the Corporation no longer
originates.
(4) Non-U.S. credit card represents the U.K. credit card portfolio which is evaluated using internal credit metrics, including delinquency status. At December 31, 2011, 96 percent of this portfolio was
current or less than 30 days past due, two percent was 30-89 days past due and two percent was 90 days or more past due.
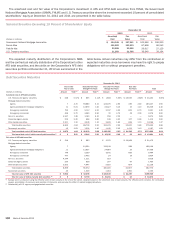
Commercial – Credit Quality Indicators (1)
December 31, 2011
(Dollars in millions)
U.S.
Commercial
Commercial
Real Estate
Commercial
Lease
Financing
Non-U.S.
Commercial
U.S. Small
Business
Commercial (2)
Risk ratings
Pass rated $ 169,599 $ 28,602 $ 20,850 $ 53,945 $2,392
Reservable criticized 10,349 10,994 1,139 1,473 836
Refreshed FICO score (3)
Less than 620 562
Greater than or equal to 620 and less than 680 624
Greater than or equal to 680 and less than 740 1,612
Greater than or equal to 740 2,438
Other internal credit metrics (3, 4) 4,787
Total commercial $ 179,948 $ 39,596 $ 21,989 $ 55,418 $13,251
(1) Excludes $6.6 billion of loans accounted for under the fair value option.
(2) U.S. small business commercial includes $491 million of criticized business card and small business loans which are evaluated using refreshed FICO scores or internal credit metrics, including
delinquency status, rather than risk ratings. At December 31, 2011, 97 percent of the balances where internal credit metrics are used were current or less than 30 days past due.
(3) Refreshed FICO score and other internal credit metrics are applicable only to the U.S. small business commercial portfolio.
(4) Other internal credit metrics may include delinquency status, application scores, geography or other factors.