Bank of America 2012 Annual Report Download - page 79
Download and view the complete annual report
Please find page 79 of the 2012 Bank of America annual report below. You can navigate through the pages in the report by either clicking on the pages listed below, or by using the keyword search tool below to find specific information within the annual report.-
 1
1 -
2
-
3
-
4
-
5
-
6
-
7
-
8
-
9
-
10
-
11
-
12
-
13
-
14
-
15
-
16
-
17
-
18
-
19
-
20
-
21
-
22
-
23
-
24
-
25
-
26
-
27
-
28
-
29
-
30
-
31
-
32
-
33
-
34
-
35
-
36
-
37
-
38
-
39
-
40
-
41
-
42
-
43
-
44
-
45
-
46
-
47
-
48
-
49
-
50
-
51
-
52
-
53
-
54
-
55
-
56
-
57
-
58
-
59
-
60
-
61
-
62
-
63
-
64
-
65
-
66
-
67
-
68
-
 69
69 -
 70
70 -
 71
71 -
 72
72 -
 73
73 -
 74
74 -
 75
75 -
 76
76 -
 77
77 -
 78
78 -
 79
79 -
 80
80 -
 81
81 -
 82
82 -
 83
83 -
 84
84 -
 85
85 -
 86
86 -
 87
87 -
 88
88 -
 89
89 -
90
-
91
-
92
-
93
-
94
-
95
-
96
-
97
-
98
-
99
-
100
-
101
-
102
-
103
-
104
-
105
-
106
-
107
-
108
-
109
-
110
-
111
-
112
-
113
-
114
-
115
-
116
-
117
-
118
-
119
-
120
-
121
-
122
-
123
-
124
-
125
-
126
-
127
-
128
-
129
-
130
-
131
-
132
-
133
-
134
-
135
-
136
-
137
-
138
-
139
-
140
-
141
-
142
-
143
-
144
-
145
-
146
-
147
-
148
-
149
-
150
-
151
-
152
-
153
-
154
-
155
-
156
-
157
-
158
-
159
-
160
-
161
-
162
-
163
-
164
-
165
-
166
-
167
-
168
-
169
-
170
-
171
-
172
-
173
-
174
-
175
-
176
-
177
-
178
-
179
-
180
-
181
-
182
-
183
-
184
-
185
-
186
-
187
-
188
-
189
-
190
-
191
-
192
-
193
-
194
-
195
-
196
-
197
-
198
-
199
-
200
-
201
-
202
-
203
-
204
-
205
-
206
-
207
-
208
-
209
-
210
-
211
-
212
-
213
-
214
-
215
-
216
-
217
-
218
-
219
-
220
-
221
-
222
-
223
-
224
-
225
-
226
-
227
-
228
-
229
-
230
-
231
-
232
-
233
-
234
-
235
-
236
-
237
-
238
-
239
-
240
-
241
-
242
-
243
-
244
-
245
-
246
-
247
-
248
-
249
-
250
-
251
-
252
-
253
-
254
-
255
-
256
-
257
-
258
-
259
-
260
-
261
-
262
-
263
-
264
-
265
-
266
-
267
-
268
-
269
-
270
-
271
-
272
-
273
-
274
-
275
-
276
-
277
-
278
-
279
-
280
-
281
-
282
-
283
-
284
 |
 |

Bank of America 2012 77
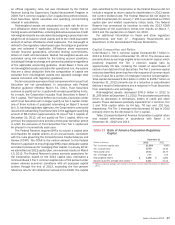
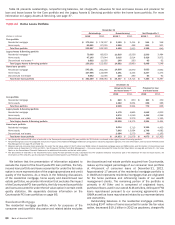
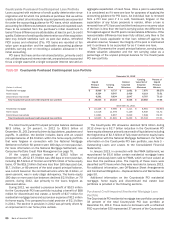
Table 20 presents our outstanding consumer loans and the
Countrywide PCI loan portfolio. Loans that were acquired from
Countrywide and considered credit-impaired were recorded at fair
value upon acquisition. In addition to being included in the
“Outstandings” columns in Table 20, these loans are also shown
separately, net of purchase accounting adjustments, in the
“Countrywide Purchased Credit-impaired Loan Portfolio” column.
For additional information, see Note 5 – Outstanding Loans and
Leases to the Consolidated Financial Statements. The impact of
the Countrywide PCI loan portfolio on certain credit statistics is
reported where appropriate. See Countrywide Purchased Credit-
impaired Loan Portfolio on page 86 for more information. Under
certain circumstances, loans that were originally classified as
discontinued real estate loans upon acquisition have been
subsequently modified from pay option or subprime loans into
loans with more conventional terms and are now included in the
residential mortgage portfolio, but continue to be classified as PCI
loans as shown in Table 20.
Table 20 Consumer Loans
December 31
Outstandings
Countrywide Purchased
Credit-impaired Loan Portfolio
(Dollars in millions) 2012 2011 2012 2011
Residential mortgage (1) $ 243,181 $262,290 $ 8,737 $ 9,966
Home equity 107,996 124,699 8,547 11,978
Discontinued real estate (2) 9,892 11,095 8,834 9,857
U.S. credit card 94,835 102,291 n/a n/a
Non-U.S. credit card 11,697 14,418 n/a n/a
Direct/Indirect consumer (3) 83,205 89,713 n/a n/a
Other consumer (4) 1,628 2,688 n/a n/a
Consumer loans excluding loans accounted for under the fair value option 552,434 607,194 26,118 31,801
Loans accounted for under the fair value option (5) 1,005 2,190 n/a n/a
Total consumer loans $ 553,439 $609,384 $26,118 $ 31,801
(1) Outstandings include non-U.S. residential mortgage loans of $93 million and $85 million at December 31, 2012 and 2011.
(2) Outstandings include $8.8 billion and $9.9 billion of pay option loans and $1.1 billion and $1.2 billion of subprime loans at December 31, 2012 and 2011. We no longer originate these products.
(3) Outstandings include dealer financial services loans of $35.9 billion and $43.0 billion, consumer lending loans of $4.7 billion and $8.0 billion, U.S. securities-based lending margin loans of $28.3
billion and $23.6 billion, student loans of $4.8 billion and $6.0 billion, non-U.S. consumer loans of $8.3 billion and $7.6 billion and other consumer loans of $1.2 billion and $1.5 billion at December
31, 2012 and 2011.
(4) Outstandings include consumer finance loans of $1.4 billion and $1.7 billion, other non-U.S. consumer loans of $5 million and $929 million and consumer overdrafts of $177 million and $103
million at December 31, 2012 and 2011.
(5) Consumer loans accounted for under the fair value option include residential mortgage loans of $147 million and $906 million and discontinued real estate loans of $858 million and $1.3 billion
at December 31, 2012 and 2011. See Consumer Portfolio Credit Risk Management – Consumer Loans Accounted for Under the Fair Value Option on page 89 and Note 22 – Fair Value Option to the
Consolidated Financial Statements for additional information on the fair value option.
n/a = not applicable