Bank of America 2012 Annual Report Download - page 174
Download and view the complete annual report
Please find page 174 of the 2012 Bank of America annual report below. You can navigate through the pages in the report by either clicking on the pages listed below, or by using the keyword search tool below to find specific information within the annual report.-
 1
1 -
2
-
3
-
4
-
5
-
6
-
7
-
8
-
9
-
10
-
11
-
12
-
13
-
14
-
15
-
16
-
17
-
18
-
19
-
20
-
21
-
22
-
23
-
24
-
25
-
26
-
27
-
28
-
29
-
30
-
31
-
32
-
33
-
34
-
35
-
36
-
37
-
38
-
39
-
40
-
41
-
42
-
43
-
44
-
45
-
46
-
47
-
48
-
49
-
50
-
51
-
52
-
53
-
54
-
55
-
56
-
57
-
58
-
59
-
60
-
61
-
62
-
63
-
64
-
65
-
66
-
67
-
68
-
69
-
70
-
71
-
72
-
73
-
74
-
75
-
76
-
77
-
78
-
79
-
80
-
81
-
82
-
83
-
84
-
85
-
86
-
87
-
88
-
89
-
90
-
91
-
92
-
93
-
94
-
95
-
96
-
97
-
98
-
99
-
100
-
101
-
102
-
103
-
104
-
105
-
106
-
107
-
108
-
109
-
110
-
111
-
112
-
113
-
114
-
115
-
116
-
117
-
118
-
119
-
120
-
121
-
122
-
123
-
124
-
125
-
126
-
127
-
128
-
129
-
130
-
131
-
132
-
133
-
134
-
135
-
136
-
137
-
138
-
139
-
140
-
141
-
142
-
143
-
144
-
145
-
146
-
147
-
148
-
149
-
150
-
151
-
152
-
153
-
154
-
155
-
156
-
157
-
158
-
159
-
160
-
161
-
162
-
163
-
 164
164 -
 165
165 -
 166
166 -
 167
167 -
 168
168 -
 169
169 -
 170
170 -
 171
171 -
 172
172 -
 173
173 -
 174
174 -
 175
175 -
 176
176 -
 177
177 -
 178
178 -
 179
179 -
 180
180 -
 181
181 -
 182
182 -
 183
183 -
 184
184 -
185
-
186
-
187
-
188
-
189
-
190
-
191
-
192
-
193
-
194
-
195
-
196
-
197
-
198
-
199
-
200
-
201
-
202
-
203
-
204
-
205
-
206
-
207
-
208
-
209
-
210
-
211
-
212
-
213
-
214
-
215
-
216
-
217
-
218
-
219
-
220
-
221
-
222
-
223
-
224
-
225
-
226
-
227
-
228
-
229
-
230
-
231
-
232
-
233
-
234
-
235
-
236
-
237
-
238
-
239
-
240
-
241
-
242
-
243
-
244
-
245
-
246
-
247
-
248
-
249
-
250
-
251
-
252
-
253
-
254
-
255
-
256
-
257
-
258
-
259
-
260
-
261
-
262
-
263
-
264
-
265
-
266
-
267
-
268
-
269
-
270
-
271
-
272
-
273
-
274
-
275
-
276
-
277
-
278
-
279
-
280
-
281
-
282
-
283
-
284
 |
 |

172 Bank of America 2012
commodity contracts and physical inventories of commodities
expose the Corporation to earnings volatility. Cash flow and fair
value accounting hedges provide a method to mitigate a portion
of this earnings volatility.
The Corporation purchases credit derivatives to manage credit
risk related to certain funded and unfunded credit exposures.
Credit derivatives include credit default swaps (CDS), total return
swaps and swaptions. These derivatives are recorded on the
Corporation’s Consolidated Balance Sheet at fair value with
changes in fair value recorded in other income (loss).
Derivatives Designated as Accounting Hedges
The Corporation uses various types of interest rate, commodity
and foreign exchange derivative contracts to protect against
changes in the fair value of its assets and liabilities due to
fluctuations in interest rates, commodity prices and exchange
rates (fair value hedges). The Corporation also uses these types
of contracts and equity derivatives to protect against changes in
the cash flows of its assets and liabilities, and other forecasted
transactions (cash flow hedges). The Corporation hedges its net
investment in consolidated non-U.S. operations determined to
have functional currencies other than the U.S. dollar using forward
exchange contracts and cross-currency basis swaps, and by
issuing foreign currency-denominated debt (net investment
hedges).
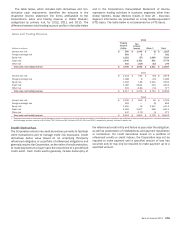
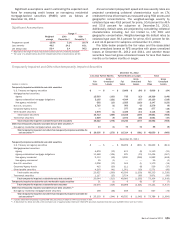
Fair Value Hedges
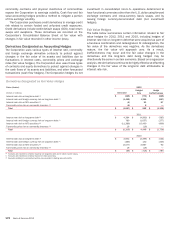
The table below summarizes certain information related to fair
value hedges for 2012, 2011 and 2010, including hedges of
interest rate risk on long-term debt that were acquired as part of
a business combination and redesignated. At redesignation, the
fair value of the derivatives was negative. As the derivatives
mature, the fair value will approach zero. As a result,
ineffectiveness may occur and the fair value changes in the
derivatives and the long-term debt being hedged may be
directionally the same in certain scenarios. Based on a regression
analysis, the derivatives continue to be highly effective at offsetting
changes in the fair value of the long-term debt attributable to
interest rate risk.
Derivatives Designated as Fair Value Hedges
Gains (losses) 2012
(Dollars in millions) Derivative
Hedged
Item
Hedge
Ineffectiveness
Interest rate risk on long-term debt (1) $ (195) $ (770) $ (965)
Interest rate and foreign currency risk on long-term debt (1) (1,482) 1,225 (257)
Interest rate risk on AFS securities (2) (4) 91 87
Commodity price risk on commodity inventory (3) (6) 6 —
Total $ (1,687)$ 552 $ (1,135)
2011
Interest rate risk on long-term debt (1) $ 4,384 $ (4,969) $ (585)
Interest rate and foreign currency risk on long-term debt (1) 780 (1,057) (277)
Interest rate risk on AFS securities (2) (11,386) 10,490 (896)
Commodity price risk on commodity inventory (3) 16 (16) —
Total $ (6,206) $ 4,448 $ (1,758)
2010
Interest rate risk on long-term debt (1) $ 2,952 $ (3,496) $ (544)
Interest rate and foreign currency risk on long-term debt (1) (463) 130 (333)
Interest rate risk on AFS securities (2) (2,577) 2,667 90
Commodity price risk on commodity inventory (3) 19 (19) —
Total $ (69) $ (718) $ (787)
(1) Amounts are recorded in interest expense on long-term debt and in other income (loss).
(2) Amounts are recorded in interest income on debt securities.
(3) Amounts relating to commodity inventory are recorded in trading account profits.