Bank of America 2012 Annual Report Download - page 207
Download and view the complete annual report
Please find page 207 of the 2012 Bank of America annual report below. You can navigate through the pages in the report by either clicking on the pages listed below, or by using the keyword search tool below to find specific information within the annual report.-
 1
1 -
2
-
3
-
4
-
5
-
6
-
7
-
8
-
9
-
10
-
11
-
12
-
13
-
14
-
15
-
16
-
17
-
18
-
19
-
20
-
21
-
22
-
23
-
24
-
25
-
26
-
27
-
28
-
29
-
30
-
31
-
32
-
33
-
34
-
35
-
36
-
37
-
38
-
39
-
40
-
41
-
42
-
43
-
44
-
45
-
46
-
47
-
48
-
49
-
50
-
51
-
52
-
53
-
54
-
55
-
56
-
57
-
58
-
59
-
60
-
61
-
62
-
63
-
64
-
65
-
66
-
67
-
68
-
69
-
70
-
71
-
72
-
73
-
74
-
75
-
76
-
77
-
78
-
79
-
80
-
81
-
82
-
83
-
84
-
85
-
86
-
87
-
88
-
89
-
90
-
91
-
92
-
93
-
94
-
95
-
96
-
97
-
98
-
99
-
100
-
101
-
102
-
103
-
104
-
105
-
106
-
107
-
108
-
109
-
110
-
111
-
112
-
113
-
114
-
115
-
116
-
117
-
118
-
119
-
120
-
121
-
122
-
123
-
124
-
125
-
126
-
127
-
128
-
129
-
130
-
131
-
132
-
133
-
134
-
135
-
136
-
137
-
138
-
139
-
140
-
141
-
142
-
143
-
144
-
145
-
146
-
147
-
148
-
149
-
150
-
151
-
152
-
153
-
154
-
155
-
156
-
157
-
158
-
159
-
160
-
161
-
162
-
163
-
164
-
165
-
166
-
167
-
168
-
169
-
170
-
171
-
172
-
173
-
174
-
175
-
176
-
177
-
178
-
179
-
180
-
181
-
182
-
183
-
184
-
185
-
186
-
187
-
188
-
189
-
190
-
191
-
192
-
193
-
194
-
195
-
196
-
 197
197 -
 198
198 -
 199
199 -
 200
200 -
 201
201 -
 202
202 -
 203
203 -
 204
204 -
 205
205 -
 206
206 -
 207
207 -
 208
208 -
 209
209 -
 210
210 -
 211
211 -
 212
212 -
 213
213 -
 214
214 -
 215
215 -
 216
216 -
 217
217 -
218
-
219
-
220
-
221
-
222
-
223
-
224
-
225
-
226
-
227
-
228
-
229
-
230
-
231
-
232
-
233
-
234
-
235
-
236
-
237
-
238
-
239
-
240
-
241
-
242
-
243
-
244
-
245
-
246
-
247
-
248
-
249
-
250
-
251
-
252
-
253
-
254
-
255
-
256
-
257
-
258
-
259
-
260
-
261
-
262
-
263
-
264
-
265
-
266
-
267
-
268
-
269
-
270
-
271
-
272
-
273
-
274
-
275
-
276
-
277
-
278
-
279
-
280
-
281
-
282
-
283
-
284
 |
 |

Bank of America 2012 205
issuer of the underlying municipal bond. If a customer holds the
residual interest in a trust, that customer typically has the
unilateral ability to liquidate the trust at any time, while the
Corporation typically has the ability to trigger the liquidation of that
trust if the market value of the bonds held in the trust declines
below a specified threshold. This arrangement is designed to limit
market losses to an amount that is less than the customer’s
residual interest, effectively preventing the Corporation from
absorbing losses incurred on assets held within that trust.
During 2012 and 2011, the Corporation was the transferor of
assets into unconsolidated municipal bond trusts and received
cash proceeds from new securitizations of $879 million and $733
million. At December 31, 2012 and 2011, the principal balance
outstanding for unconsolidated municipal bond securitization
trusts for which the Corporation was transferor was $1.4 billion
and $2.5 billion.
The Corporation’s liquidity commitments to unconsolidated
municipal bond trusts, including those for which the Corporation
was transferor, totaled $2.8 billion and $3.5 billion at
December 31, 2012 and 2011. The weighted-average remaining
life of bonds held in the trusts at December 31, 2012 was 8.4
years. There were no material write-downs or downgrades of assets
or issuers during 2012 and 2011.
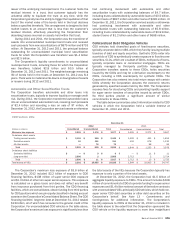
Automobile and Other Securitization Trusts
The Corporation transfers automobile and other loans into
securitization trusts, typically to improve liquidity or manage credit
risk. During 2012, the Corporation transferred automobile loans
into an unconsolidated automobile trust, receiving cash proceeds
of $2.4 billion and recording a loss on sale of $7 million. At
December 31, 2012, the Corporation serviced assets or otherwise
had continuing involvement with automobile and other
securitization trusts with outstanding balances of $4.7 billion,
including trusts collateralized by automobile loans of $3.5 billion,
student loans of $897 million and other loans of $290 million. At
December 31, 2011, the Corporation serviced assets or otherwise
had continuing involvement with automobile and other
securitization trusts with outstanding balances of $5.8 billion,
including trusts collateralized by automobile loans of $3.9 billion,
student loans of $1.2 billion and other loans of $668 million.
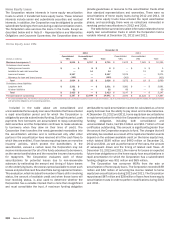
Collateralized Debt Obligation Vehicles
CDO vehicles hold diversified pools of fixed-income securities,
typically corporate debt or ABS, which they fund by issuing multiple
tranches of debt and equity securities. Synthetic CDOs enter into
a portfolio of CDS to synthetically create exposure to fixed-income
securities. CLOs, which are a subset of CDOs, hold pools of loans,
typically corporate loans or commercial mortgages. CDOs are
typically managed by third-party portfolio managers. The
Corporation transfers assets to these CDOs, holds securities
issued by the CDOs and may be a derivative counterparty to the
CDOs, including a CDS counterparty for synthetic CDOs. The
Corporation has also entered into total return swaps with certain
CDOs whereby the Corporation absorbs the economic returns
generated by specified assets held by the CDO. The Corporation
receives fees for structuring CDOs and providing liquidity support
for super senior tranches of securities issued by certain CDOs.
No third parties provide a significant amount of similar
commitments to these CDOs.
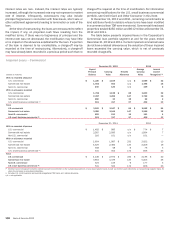
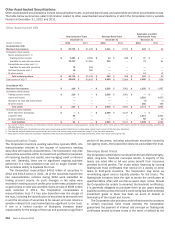
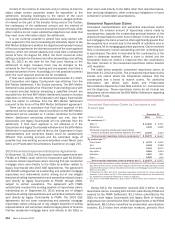
The table below summarizes select information related to CDO
vehicles in which the Corporation held a variable interest at
December 31, 2012 and 2011.
CDO Vehicle VIEs
December 31
2012 2011
(Dollars in millions) Consolidated Unconsolidated Total Consolidated Unconsolidated Total
Maximum loss exposure $ 2,201 $ 1,376 $ 3,577 $ 1,695 $ 2,272 $ 3,967
On-balance sheet assets
Trading account assets $ 2,191 $ 258 $ 2,449 $ 1,392 $ 461 $ 1,853
Derivative assets 10 301 311 452 678 1,130
All other assets — 76 76 — 96 96
Total $ 2,201 $ 635 $ 2,836 $ 1,844 $ 1,235 $ 3,079
On-balance sheet liabilities
Derivative liabilities $—$9$9
$—$ 11 $ 11
Long-term debt 2,806 2 2,808 2,712 2 2,714
Total $ 2,806 $ 11 $ 2,817 $ 2,712 $ 13 $ 2,725
Total assets of VIEs $ 2,201 $ 26,985 $ 29,186 $ 1,844 $ 32,903 $ 34,747
The Corporation’s maximum loss exposure of $3.6 billion at
December 31, 2012 included $2.2 billion of exposure to CDO
financing facilities, $138 million of super senior CDO exposure
and $1.3 billion of other non-super senior exposure. This exposure
is calculated on a gross basis and does not reflect any benefit
from insurance purchased from third parties. The CDO financing
facilities, which are consolidated, obtain funding from third parties
for CDO positions which are principally classified in trading account
assets on the Corporation’s Consolidated Balance Sheet. The CDO
financing facilities’ long-term debt at December 31, 2012 totaled
$2.8 billion, all of which has recourse to the general credit of the
Corporation. For unconsolidated CDO vehicles in the table above,
the Corporation’s maximum loss exposure is significantly less than
the total assets of the VIEs because the Corporation typically has
exposure to only a portion of the total assets.
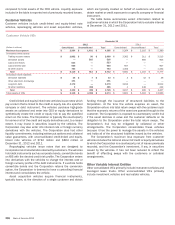
At December 31, 2012, the Corporation had $1.5 billion of
aggregate liquidity exposure to CDOs. This amount includes $108
million of commitments to CDOs to provide funding for super senior
exposures and $1.4 billion notional amount of derivative contracts
with unconsolidated VIEs, principally CDO vehicles, which hold non-
super senior CDO debt securities or other debt securities on the
Corporation’s behalf. See Note 13 – Commitments and
Contingencies for additional information. The Corporation’s
liquidity exposure to CDOs at December 31, 2012 is included in
the table above to the extent that the Corporation sponsored the
CDO vehicle or the liquidity exposure is more than insignificant