Bank of America 2012 Annual Report Download - page 113
Download and view the complete annual report
Please find page 113 of the 2012 Bank of America annual report below. You can navigate through the pages in the report by either clicking on the pages listed below, or by using the keyword search tool below to find specific information within the annual report.-
 1
1 -
2
-
3
-
4
-
5
-
6
-
7
-
8
-
9
-
10
-
11
-
12
-
13
-
14
-
15
-
16
-
17
-
18
-
19
-
20
-
21
-
22
-
23
-
24
-
25
-
26
-
27
-
28
-
29
-
30
-
31
-
32
-
33
-
34
-
35
-
36
-
37
-
38
-
39
-
40
-
41
-
42
-
43
-
44
-
45
-
46
-
47
-
48
-
49
-
50
-
51
-
52
-
53
-
54
-
55
-
56
-
57
-
58
-
59
-
60
-
61
-
62
-
63
-
64
-
65
-
66
-
67
-
68
-
69
-
70
-
71
-
72
-
73
-
74
-
75
-
76
-
77
-
78
-
79
-
80
-
81
-
82
-
83
-
84
-
85
-
86
-
87
-
88
-
89
-
90
-
91
-
92
-
93
-
94
-
95
-
96
-
97
-
98
-
99
-
100
-
101
-
102
-
 103
103 -
 104
104 -
 105
105 -
 106
106 -
 107
107 -
 108
108 -
 109
109 -
 110
110 -
 111
111 -
 112
112 -
 113
113 -
 114
114 -
 115
115 -
 116
116 -
 117
117 -
 118
118 -
 119
119 -
 120
120 -
 121
121 -
 122
122 -
 123
123 -
124
-
125
-
126
-
127
-
128
-
129
-
130
-
131
-
132
-
133
-
134
-
135
-
136
-
137
-
138
-
139
-
140
-
141
-
142
-
143
-
144
-
145
-
146
-
147
-
148
-
149
-
150
-
151
-
152
-
153
-
154
-
155
-
156
-
157
-
158
-
159
-
160
-
161
-
162
-
163
-
164
-
165
-
166
-
167
-
168
-
169
-
170
-
171
-
172
-
173
-
174
-
175
-
176
-
177
-
178
-
179
-
180
-
181
-
182
-
183
-
184
-
185
-
186
-
187
-
188
-
189
-
190
-
191
-
192
-
193
-
194
-
195
-
196
-
197
-
198
-
199
-
200
-
201
-
202
-
203
-
204
-
205
-
206
-
207
-
208
-
209
-
210
-
211
-
212
-
213
-
214
-
215
-
216
-
217
-
218
-
219
-
220
-
221
-
222
-
223
-
224
-
225
-
226
-
227
-
228
-
229
-
230
-
231
-
232
-
233
-
234
-
235
-
236
-
237
-
238
-
239
-
240
-
241
-
242
-
243
-
244
-
245
-
246
-
247
-
248
-
249
-
250
-
251
-
252
-
253
-
254
-
255
-
256
-
257
-
258
-
259
-
260
-
261
-
262
-
263
-
264
-
265
-
266
-
267
-
268
-
269
-
270
-
271
-
272
-
273
-
274
-
275
-
276
-
277
-
278
-
279
-
280
-
281
-
282
-
283
-
284
 |
 |

Bank of America 2012 111
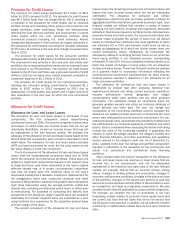
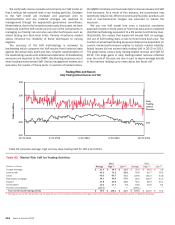
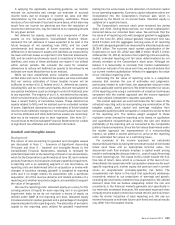
The histogram below is a graphic depiction of trading volatility
and illustrates the daily level of trading-related revenue for 2012
and 2011. During 2012, positive trading-related revenue was
recorded for 98 percent, or 243 of the 249 trading days of which
80 percent (199 days) were daily trading gains of over $25 million,
less than one percent (1 day) of the trading days had losses greater
than $25 million and the largest loss was $50 million. This is
compared to 2011, where positive trading-related revenue was
recorded for 86 percent, or 214 of the 250 trading days of which
66 percent (165 days) were daily trading gains of over $25 million,
five percent (12 days) of the trading days had losses greater than
$25 million and the largest loss was $119 million.
To evaluate risk in our trading activities, we focus on the actual
and potential volatility of individual positions as well as portfolios.
VaR is a key statistic used to measure market risk. In order to
manage day-to-day risks, VaR is subject to trading limits both for
our overall trading portfolio and within individual businesses. All
trading limit excesses are communicated to management for
review.
A VaR model simulates the value of a portfolio under a range
of hypothetical scenarios in order to generate a distribution of
potential gains and losses. VaR represents the loss the portfolio
is expected to experience within a given confidence level based
on historical data. With any VaR model, there are significant and
numerous assumptions that will differ from company to company.
In addition, the accuracy of a VaR model depends on the availability
and quality of historical data for each of the positions in the
portfolio. A VaR model may require additional modeling
assumptions for new products that do not have extensive historical
price data or for illiquid positions for which accurate daily prices
are not consistently available.
A VaR model is an effective tool in estimating ranges of potential
gains and losses on our trading portfolios. There are, however,
many limitations inherent in a VaR model as it utilizes historical
results over a defined time period to estimate future performance.
Historical results may not always be indicative of future results
and changes in market conditions or in the composition of the
underlying portfolio could have a material impact on the accuracy
of the VaR model. In order for the VaR model to reflect current
market conditions, we update the historical data underlying our
VaR model on a bi-weekly basis and regularly review the
assumptions underlying the model. Our VaR model utilizes three
years of historical data. This time period was chosen to ensure
that VaR reflects both a broad range of market movements as well
as being sensitive to recent changes in market volatility. In
addition, certain types of risks associated with positions that are
illiquid and/or unobservable are not included in VaR. If these risks
are determined to be material, the VaR model results will be
supplemented.