Bank of America 2012 Annual Report Download - page 47
Download and view the complete annual report
Please find page 47 of the 2012 Bank of America annual report below. You can navigate through the pages in the report by either clicking on the pages listed below, or by using the keyword search tool below to find specific information within the annual report.-
 1
1 -
2
-
3
-
4
-
5
-
6
-
7
-
8
-
9
-
10
-
11
-
12
-
13
-
14
-
15
-
16
-
17
-
18
-
19
-
20
-
21
-
22
-
23
-
24
-
25
-
26
-
27
-
28
-
29
-
30
-
31
-
32
-
33
-
34
-
35
-
36
-
 37
37 -
 38
38 -
 39
39 -
 40
40 -
 41
41 -
 42
42 -
 43
43 -
 44
44 -
 45
45 -
 46
46 -
 47
47 -
 48
48 -
 49
49 -
 50
50 -
 51
51 -
 52
52 -
 53
53 -
 54
54 -
 55
55 -
 56
56 -
 57
57 -
58
-
59
-
60
-
61
-
62
-
63
-
64
-
65
-
66
-
67
-
68
-
69
-
70
-
71
-
72
-
73
-
74
-
75
-
76
-
77
-
78
-
79
-
80
-
81
-
82
-
83
-
84
-
85
-
86
-
87
-
88
-
89
-
90
-
91
-
92
-
93
-
94
-
95
-
96
-
97
-
98
-
99
-
100
-
101
-
102
-
103
-
104
-
105
-
106
-
107
-
108
-
109
-
110
-
111
-
112
-
113
-
114
-
115
-
116
-
117
-
118
-
119
-
120
-
121
-
122
-
123
-
124
-
125
-
126
-
127
-
128
-
129
-
130
-
131
-
132
-
133
-
134
-
135
-
136
-
137
-
138
-
139
-
140
-
141
-
142
-
143
-
144
-
145
-
146
-
147
-
148
-
149
-
150
-
151
-
152
-
153
-
154
-
155
-
156
-
157
-
158
-
159
-
160
-
161
-
162
-
163
-
164
-
165
-
166
-
167
-
168
-
169
-
170
-
171
-
172
-
173
-
174
-
175
-
176
-
177
-
178
-
179
-
180
-
181
-
182
-
183
-
184
-
185
-
186
-
187
-
188
-
189
-
190
-
191
-
192
-
193
-
194
-
195
-
196
-
197
-
198
-
199
-
200
-
201
-
202
-
203
-
204
-
205
-
206
-
207
-
208
-
209
-
210
-
211
-
212
-
213
-
214
-
215
-
216
-
217
-
218
-
219
-
220
-
221
-
222
-
223
-
224
-
225
-
226
-
227
-
228
-
229
-
230
-
231
-
232
-
233
-
234
-
235
-
236
-
237
-
238
-
239
-
240
-
241
-
242
-
243
-
244
-
245
-
246
-
247
-
248
-
249
-
250
-
251
-
252
-
253
-
254
-
255
-
256
-
257
-
258
-
259
-
260
-
261
-
262
-
263
-
264
-
265
-
266
-
267
-
268
-
269
-
270
-
271
-
272
-
273
-
274
-
275
-
276
-
277
-
278
-
279
-
280
-
281
-
282
-
283
-
284
 |
 |

Bank of America 2012 45
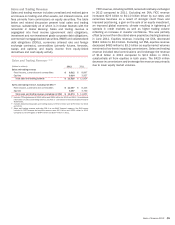
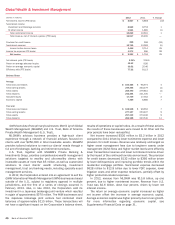
Sales and Trading Revenue
Sales and trading revenue includes unrealized and realized gains
and losses on trading and other assets, net interest income, and
fees primarily from commissions on equity securities. The table
below and related discussion present total sales and trading
revenue, substantially all of which is in Global Markets with the
remainder in Global Banking. Sales and trading revenue is
segregated into fixed income (government debt obligations,
investment and non-investment grade corporate debt obligations,
commercial mortgage-backed securities, RMBS and collateralized
debt obligations (CDOs)), currencies (interest rate and foreign
exchange contracts), commodities (primarily futures, forwards,
swaps and options) and equity income from equity-linked
derivatives and cash equity activity.
Sales and Trading Revenue (1, 2)
(Dollars in millions) 2012 2011
Sales and trading revenue
Fixed income, currencies and commodities $ 8,812 $ 8,897
Equities 3,014 3,957
Total sales and trading revenue $ 11,826 $ 12,854
Sales and trading revenue, excluding net DVA (3)
Fixed income, currencies and commodities $ 11,007 $ 8,103
Equities 3,267 3,750
Total sales and trading revenue, excluding net DVA $ 14,274 $ 11,853
(1) Includes FTE adjustments of $219 million and $204 million for 2012 and 2011. For additional
information on sales and trading revenue, see Note 3 – Derivatives to the Consolidated Financial
Statements.
(2) Includes Global Banking sales and trading revenue of $521 million and $270 million for 2012
and 2011.
(3) Sales and trading revenue, excluding DVA is a non-GAAP financial measure. Net DVA losses
included in FICC revenue and equities revenue were $2.2 billion and $253 million in 2012
compared to net DVA gains of $794 million and $207 million in 2011.
FICC revenue, including net DVA, remained relatively unchanged
in 2012 compared to 2011. Excluding net DVA, FICC revenue
increased $2.9 billion to $11.0 billion driven by our rates and
currencies business as a result of stronger client flows and
improved positioning, a gain on the sale of an equity investment,
an improved global economic climate resulting in tightening of
spreads in credit markets as well as higher trading volume
reflecting an increase in investor confidence. This was partially
offset by our exit from the stand-alone proprietary trading business
in June 2011. Equities revenue, including net DVA, decreased
$943 million to $3.0 billion. Excluding net DVA, equities revenue
decreased $483 million to $3.3 billion as equity market volumes
remained at low levels impacting commissions. Sales and trading
revenue included total commissions and brokerage fee revenue
of $1.8 billion in 2012 compared to $2.2 billion in 2011,
substantially all from equities in both years. The $429 million
decrease in commissions and brokerage fee revenue was primarily
due to lower equity market volumes.