Bank of America 2012 Annual Report Download - page 197
Download and view the complete annual report
Please find page 197 of the 2012 Bank of America annual report below. You can navigate through the pages in the report by either clicking on the pages listed below, or by using the keyword search tool below to find specific information within the annual report.-
 1
1 -
2
-
3
-
4
-
5
-
6
-
7
-
8
-
9
-
10
-
11
-
12
-
13
-
14
-
15
-
16
-
17
-
18
-
19
-
20
-
21
-
22
-
23
-
24
-
25
-
26
-
27
-
28
-
29
-
30
-
31
-
32
-
33
-
34
-
35
-
36
-
37
-
38
-
39
-
40
-
41
-
42
-
43
-
44
-
45
-
46
-
47
-
48
-
49
-
50
-
51
-
52
-
53
-
54
-
55
-
56
-
57
-
58
-
59
-
60
-
61
-
62
-
63
-
64
-
65
-
66
-
67
-
68
-
69
-
70
-
71
-
72
-
73
-
74
-
75
-
76
-
77
-
78
-
79
-
80
-
81
-
82
-
83
-
84
-
85
-
86
-
87
-
88
-
89
-
90
-
91
-
92
-
93
-
94
-
95
-
96
-
97
-
98
-
99
-
100
-
101
-
102
-
103
-
104
-
105
-
106
-
107
-
108
-
109
-
110
-
111
-
112
-
113
-
114
-
115
-
116
-
117
-
118
-
119
-
120
-
121
-
122
-
123
-
124
-
125
-
126
-
127
-
128
-
129
-
130
-
131
-
132
-
133
-
134
-
135
-
136
-
137
-
138
-
139
-
140
-
141
-
142
-
143
-
144
-
145
-
146
-
147
-
148
-
149
-
150
-
151
-
152
-
153
-
154
-
155
-
156
-
157
-
158
-
159
-
160
-
161
-
162
-
163
-
164
-
165
-
166
-
167
-
168
-
169
-
170
-
171
-
172
-
173
-
174
-
175
-
176
-
177
-
178
-
179
-
180
-
181
-
182
-
183
-
184
-
185
-
186
-
 187
187 -
 188
188 -
 189
189 -
 190
190 -
 191
191 -
 192
192 -
 193
193 -
 194
194 -
 195
195 -
 196
196 -
 197
197 -
 198
198 -
 199
199 -
 200
200 -
 201
201 -
 202
202 -
 203
203 -
 204
204 -
 205
205 -
 206
206 -
 207
207 -
208
-
209
-
210
-
211
-
212
-
213
-
214
-
215
-
216
-
217
-
218
-
219
-
220
-
221
-
222
-
223
-
224
-
225
-
226
-
227
-
228
-
229
-
230
-
231
-
232
-
233
-
234
-
235
-
236
-
237
-
238
-
239
-
240
-
241
-
242
-
243
-
244
-
245
-
246
-
247
-
248
-
249
-
250
-
251
-
252
-
253
-
254
-
255
-
256
-
257
-
258
-
259
-
260
-
261
-
262
-
263
-
264
-
265
-
266
-
267
-
268
-
269
-
270
-
271
-
272
-
273
-
274
-
275
-
276
-
277
-
278
-
279
-
280
-
281
-
282
-
283
-
284
 |
 |

Bank of America 2012 195
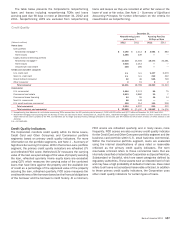
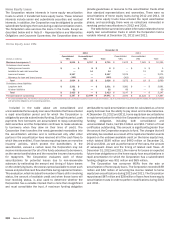
At December 31, 2012 and 2011, the Corporation had a
renegotiated TDR portfolio of $3.9 billion and $7.1 billion of which
$3.1 billion was current or less than 30 days past due under the
modified terms at December 31, 2012.
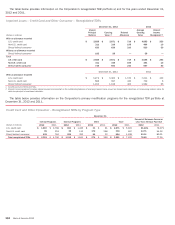
The table below provides information on the Corporation’s
renegotiated TDR portfolio including the unpaid principal balance,
carrying value and average pre- and post-modification interest
rates of loans that were modified in TDRs during 2012 and 2011,
and net charge-offs that were recorded during the period in which
the modification occurred.
Credit Card and Other Consumer – Renegotiated TDRs Entered into During 2012 and 2011
December 31, 2012 2012
(Dollars in millions)
Unpaid
Principal
Balance
Carrying
Value (1)
Pre-
modification
Interest Rate
Post-
modification
Interest Rate
Net Charge-
offs
U.S. credit card $396 $400 17.59% 6.36% $ 45
Non-U.S. credit card 196 206 26.19 1.15 190
Direct/Indirect consumer 160 113 9.59 5.72 52
Total $ 752 $719 18.79 4.77 $ 287
December 31, 2011 2011
U.S. credit card $ 890 $ 902 19.04% 6.16% $ 106
Non-U.S. credit card 305 322 26.32 1.04 291
Direct/Indirect consumer 198 199 15.63 5.22 23
Total $ 1,393 $ 1,423 20.20 4.87 $ 420
(1) Includes accrued interest and fees.
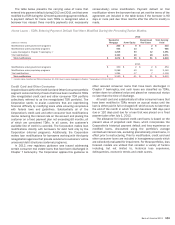
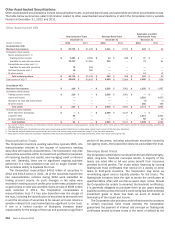
The table below provides information on the Corporation’s primary modification programs for the renegotiated TDR portfolio for
loans that were modified in TDRs during 2012 and 2011.
Credit Card and Other Consumer – Renegotiated TDRs by Program Type
Renegotiated TDRs Entered into During 2012
December 31, 2012
(Dollars in millions)
Internal
Programs
External
Programs Other Total
U.S. credit card $248 $152 $—$ 400
Non-U.S. credit card 112 94 —206
Direct/Indirect consumer 36 19 58 113
Total renegotiated TDR loans $ 396 $265 $58 $ 719
Renegotiated TDRs Entered into During 2011
December 31, 2011
U.S. credit card $ 492 $ 407 $ 3 $ 902
Non-U.S. credit card 163 158 1 322
Direct/Indirect consumer 112 87 — 199
Total renegotiated TDR loans $ 767 $ 652 $ 4 $ 1,423
Credit card and other consumer loans are deemed to be in
payment default during the quarter in which a borrower misses the
second of two consecutive payments. Payment defaults are one
of the factors considered when projecting future cash flows in the
calculation of the allowance for loan losses for impaired credit
card and other consumer loans. At December 31, 2012, the
allowance for loan and lease losses on the Corporation’s
renegotiated portfolio was 29.04 percent of the carrying value of
these loans. Loans that entered into payment default during 2012
and 2011 that had been modified in a TDR during the 12 months
preceding payment default were $203 million and $863 million for
U.S. credit card, $298 million and $409 million for non-U.S. credit
card and $35 million and $180 million for direct/indirect consumer.
Commercial Loans
Impaired commercial loans, which include nonperforming loans
and TDRs (both performing and nonperforming) are primarily
measured based on the present value of payments expected to
be received, discounted at the loan’s original effective interest
rate. Commercial impaired loans may also be measured based on
observable market prices or, for loans that are solely dependent
on the collateral for repayment, the estimated fair value of
collateral less estimated costs to sell. If the carrying value of a
loan exceeds this amount, a specific allowance is recorded as a
component of the allowance for loan and lease losses.
Modifications of loans to commercial borrowers that are
experiencing financial difficulty are designed to reduce the
Corporation’s loss exposure while providing the borrower with an
opportunity to work through financial difficulties, often to avoid
foreclosure or bankruptcy. Each modification is unique and reflects
the individual circumstances of the borrower. Modifications that
result in a TDR may include extensions of maturity at a
concessionary (below market) rate of interest, payment
forbearances or other actions designed to benefit the customer
while mitigating the Corporation’s risk exposure. Reductions in