Bank of America 2012 Annual Report Download - page 30
Download and view the complete annual report
Please find page 30 of the 2012 Bank of America annual report below. You can navigate through the pages in the report by either clicking on the pages listed below, or by using the keyword search tool below to find specific information within the annual report.-
 1
1 -
2
-
3
-
4
-
5
-
6
-
7
-
8
-
9
-
10
-
11
-
12
-
13
-
14
-
15
-
16
-
17
-
18
-
19
-
 20
20 -
 21
21 -
 22
22 -
 23
23 -
 24
24 -
 25
25 -
 26
26 -
 27
27 -
 28
28 -
 29
29 -
 30
30 -
 31
31 -
 32
32 -
 33
33 -
 34
34 -
 35
35 -
 36
36 -
 37
37 -
 38
38 -
 39
39 -
 40
40 -
41
-
42
-
43
-
44
-
45
-
46
-
47
-
48
-
49
-
50
-
51
-
52
-
53
-
54
-
55
-
56
-
57
-
58
-
59
-
60
-
61
-
62
-
63
-
64
-
65
-
66
-
67
-
68
-
69
-
70
-
71
-
72
-
73
-
74
-
75
-
76
-
77
-
78
-
79
-
80
-
81
-
82
-
83
-
84
-
85
-
86
-
87
-
88
-
89
-
90
-
91
-
92
-
93
-
94
-
95
-
96
-
97
-
98
-
99
-
100
-
101
-
102
-
103
-
104
-
105
-
106
-
107
-
108
-
109
-
110
-
111
-
112
-
113
-
114
-
115
-
116
-
117
-
118
-
119
-
120
-
121
-
122
-
123
-
124
-
125
-
126
-
127
-
128
-
129
-
130
-
131
-
132
-
133
-
134
-
135
-
136
-
137
-
138
-
139
-
140
-
141
-
142
-
143
-
144
-
145
-
146
-
147
-
148
-
149
-
150
-
151
-
152
-
153
-
154
-
155
-
156
-
157
-
158
-
159
-
160
-
161
-
162
-
163
-
164
-
165
-
166
-
167
-
168
-
169
-
170
-
171
-
172
-
173
-
174
-
175
-
176
-
177
-
178
-
179
-
180
-
181
-
182
-
183
-
184
-
185
-
186
-
187
-
188
-
189
-
190
-
191
-
192
-
193
-
194
-
195
-
196
-
197
-
198
-
199
-
200
-
201
-
202
-
203
-
204
-
205
-
206
-
207
-
208
-
209
-
210
-
211
-
212
-
213
-
214
-
215
-
216
-
217
-
218
-
219
-
220
-
221
-
222
-
223
-
224
-
225
-
226
-
227
-
228
-
229
-
230
-
231
-
232
-
233
-
234
-
235
-
236
-
237
-
238
-
239
-
240
-
241
-
242
-
243
-
244
-
245
-
246
-
247
-
248
-
249
-
250
-
251
-
252
-
253
-
254
-
255
-
256
-
257
-
258
-
259
-
260
-
261
-
262
-
263
-
264
-
265
-
266
-
267
-
268
-
269
-
270
-
271
-
272
-
273
-
274
-
275
-
276
-
277
-
278
-
279
-
280
-
281
-
282
-
283
-
284
 |
 |

28 Bank of America 2012
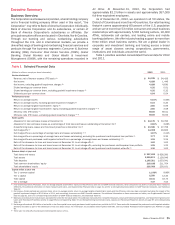
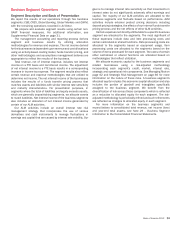
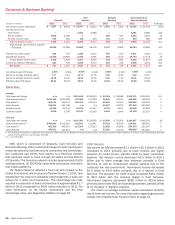
Business Segment Results
The following discussion provides an overview of the results of our business segments and All Other for 2012 compared to 2011. For
additional information on these results, see Business Segment Operations on page 33.
Table 6 Business Segment Results
Total Revenue (1)
Provision for Credit
Losses Noninterest Expense Net Income (Loss)
(Dollars in millions) 2012 2011 2012 2011 2012 2011 2012 2011
Consumer & Business Banking $ 29,023 $ 32,880 $ 3,941 $ 3,490 $ 16,793 $ 17,719 $ 5,321 $ 7,447
Consumer Real Estate Services 8,759 (3,154) 1,442 4,524 17,306 21,791 (6,507)(19,465)
Global Banking 17,207 17,312 (103) (1,118) 8,308 8,884 5,725 6,046
Global Markets 13,519 14,798 3(56) 10,839 12,244 1,054 988
Global Wealth & Investment Management 16,517 16,495 266 398 12,755 13,383 2,223 1,718
All Other (790) 16,095 2,620 6,172 6,092 6,253 (3,628)4,712
Total FTE basis 84,235 94,426 8,169 13,410 72,093 80,274 4,188 1,446
FTE adjustment (901) (972) ——————
Total Consolidated $ 83,334 $ 93,454 $ 8,169 $ 13,410 $ 72,093 $ 80,274 $ 4,188 $ 1,446
(1) Total revenue is net of interest expense and is on a FTE basis which for consolidated revenue is a non-GAAP financial measure. For more information on this measure, see Supplemental Financial
Data on page 31, and for a corresponding reconciliation to a GAAP financial measure, see Statistical Table XVI.
CBB net income decreased compared to the prior year. Revenue
decreased driven by lower average loan balances, the continued
low rate environment, the full-year impact of the Durbin
Amendment, lower gains on sales of portfolios and the impact of
charges related to our consumer protection products. The
provision for credit losses increased as portfolio trends stabilized
during 2012. Noninterest expense declined due to lower Federal
Deposit Insurance Corporation (FDIC) and operating expenses,
partially offset by an increase in litigation expense.
CRES net loss decreased compared to the prior year. Revenue
increased due to a significantly lower representations and
warranties provision, an increase in servicing income and core
production income, partially offset by a decrease in insurance
income. The provision for credit losses decreased due to improved
portfolio trends and increasing home prices in both the non-PCI
and PCI home equity loan portfolios. Noninterest expense
decreased due to a decline in litigation expense, the absence of
a goodwill impairment charge and lower mortgage-related
assessments, waivers and similar costs related to foreclosure
delays, partially offset by higher default-related servicing costs and
a provision for the 2013 IFR Acceleration Agreement.
Global Banking net income decreased compared to the prior
year. Revenue decreased primarily driven by lower investment
banking fees, lower net interest income as a result of spread
compression and the benefit in the prior year from higher accretion
on acquired portfolios, partially offset by the impact of higher
average loan and deposit balances and gains from certain legacy
portfolios. The provision for credit losses increased as a result of
stabilization of asset quality, core commercial loan growth and the
impact of a higher volume of loan resolutions in the commercial
real estate portfolio in the prior year. Noninterest expense
decreased primarily due to lower personnel and operating
expenses.
Global Markets net income increased compared to the prior
year. Sales and trading revenue decreased due to net DVA losses
compared to net DVA gains in the prior year. Excluding net DVA,
sales and trading revenue increased primarily driven by our fixed
income, currencies and commodities (FICC) business as a result
of improved performance in our rates and currencies, and credit-
related businesses due to an improved global economic climate,
and a gain on the sale of an equity investment. Noninterest
expense decreased largely due to a reduction in personnel-related
expenses.
GWIM net income increased compared to the prior year.
Revenue was relatively unchanged as higher asset management
fees were offset by lower transactional revenue and lower net
interest income driven by the impact of the continued low rate
environment. The provision for credit losses decreased driven by
lower delinquencies and improving portfolio trends within the
residential mortgage portfolio. Noninterest expense decreased
due to lower FDIC expense, lower litigation costs and other expense
reductions, partially offset by higher production-related expenses.
All Other decreased to a net loss compared to net income in
the prior year. The change was primarily due to negative fair value
adjustments on structured liabilities compared to positive fair
value adjustments in the prior year, a decrease in equity investment
income and lower gains on sales of debt securities. Partially
offsetting these items were a reduction in the provision for credit
losses, net gains resulting from the repurchase of certain debt
and trust preferred securities and a net income tax benefit related
to the recognition of certain foreign tax credits.