Bank of America 2012 Annual Report Download - page 50
Download and view the complete annual report
Please find page 50 of the 2012 Bank of America annual report below. You can navigate through the pages in the report by either clicking on the pages listed below, or by using the keyword search tool below to find specific information within the annual report.-
 1
1 -
2
-
3
-
4
-
5
-
6
-
7
-
8
-
9
-
10
-
11
-
12
-
13
-
14
-
15
-
16
-
17
-
18
-
19
-
20
-
21
-
22
-
23
-
24
-
25
-
26
-
27
-
28
-
29
-
30
-
31
-
32
-
33
-
34
-
35
-
36
-
37
-
38
-
39
-
 40
40 -
 41
41 -
 42
42 -
 43
43 -
 44
44 -
 45
45 -
 46
46 -
 47
47 -
 48
48 -
 49
49 -
 50
50 -
 51
51 -
 52
52 -
 53
53 -
 54
54 -
 55
55 -
 56
56 -
 57
57 -
 58
58 -
 59
59 -
 60
60 -
61
-
62
-
63
-
64
-
65
-
66
-
67
-
68
-
69
-
70
-
71
-
72
-
73
-
74
-
75
-
76
-
77
-
78
-
79
-
80
-
81
-
82
-
83
-
84
-
85
-
86
-
87
-
88
-
89
-
90
-
91
-
92
-
93
-
94
-
95
-
96
-
97
-
98
-
99
-
100
-
101
-
102
-
103
-
104
-
105
-
106
-
107
-
108
-
109
-
110
-
111
-
112
-
113
-
114
-
115
-
116
-
117
-
118
-
119
-
120
-
121
-
122
-
123
-
124
-
125
-
126
-
127
-
128
-
129
-
130
-
131
-
132
-
133
-
134
-
135
-
136
-
137
-
138
-
139
-
140
-
141
-
142
-
143
-
144
-
145
-
146
-
147
-
148
-
149
-
150
-
151
-
152
-
153
-
154
-
155
-
156
-
157
-
158
-
159
-
160
-
161
-
162
-
163
-
164
-
165
-
166
-
167
-
168
-
169
-
170
-
171
-
172
-
173
-
174
-
175
-
176
-
177
-
178
-
179
-
180
-
181
-
182
-
183
-
184
-
185
-
186
-
187
-
188
-
189
-
190
-
191
-
192
-
193
-
194
-
195
-
196
-
197
-
198
-
199
-
200
-
201
-
202
-
203
-
204
-
205
-
206
-
207
-
208
-
209
-
210
-
211
-
212
-
213
-
214
-
215
-
216
-
217
-
218
-
219
-
220
-
221
-
222
-
223
-
224
-
225
-
226
-
227
-
228
-
229
-
230
-
231
-
232
-
233
-
234
-
235
-
236
-
237
-
238
-
239
-
240
-
241
-
242
-
243
-
244
-
245
-
246
-
247
-
248
-
249
-
250
-
251
-
252
-
253
-
254
-
255
-
256
-
257
-
258
-
259
-
260
-
261
-
262
-
263
-
264
-
265
-
266
-
267
-
268
-
269
-
270
-
271
-
272
-
273
-
274
-
275
-
276
-
277
-
278
-
279
-
280
-
281
-
282
-
283
-
284
 |
 |

48 Bank of America 2012
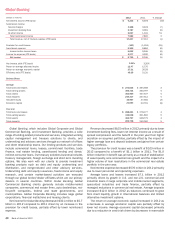
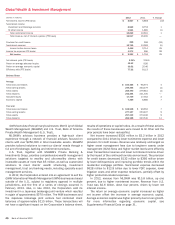
All Other
(Dollars in millions) 2012 2011 % Change
Net interest income (FTE basis) $ 1,111 $ 1,946 (43)%
Noninterest income:
Card income 360 465 (23)
Equity investment income 1,135 7,105 (84)
Gains on sales of debt securities 1,510 3,097 (51)
All other income (loss) (4,906)3,482 n/m
Total noninterest income (loss) (1,901)14,149 n/m
Total revenue, net of interest expense (FTE basis) (790) 16,095 n/m
Provision for credit losses 2,620 6,172 (58)
Goodwill impairment —581 (100)
Merger and restructuring charges —638 (100)
All other noninterest expense 6,092 5,034 21
Income (loss) before income taxes (9,502)3,670 n/m
Income tax benefit (FTE basis) (5,874)(1,042) n/m
Net income (loss) $ (3,628)$ 4,712 n/m
Balance Sheet
Average
Loans and leases:
Residential mortgage $ 213,715 $227,698 (6)
Non-U.S. credit card 13,549 24,049 (44)
Discontinued real estate 10,223 12,106 (16)
Other 20,525 25,157 (18)
Total loans and leases 258,012 289,010 (11)
Total assets (1) 302,287 380,253 (21)
Total deposits 43,083 62,582 (31)
Allocated equity (2) 87,103 72,578 20
Year end
Loans and leases:
Residential mortgage $ 201,727 $224,657 (10)
Non-U.S. credit card 11,697 14,418 (19)
Discontinued real estate 9,892 11,095 (11)
Other 17,351 22,215 (22)
Total loans and leases 240,667 272,385 (12)
Total assets (1) 247,284 320,491 (23)
Total deposits 36,061 45,532 (21)
(1) For presentation purposes, in segments where the total of liabilities and equity exceeds assets, which are generally deposit-taking segments, we allocate assets from All Other to those segments
to match liabilities (i.e., deposits) and allocated equity. Such allocated assets were $520.5 billion and $496.1 billion for 2012 and 2011, and $554.4 billion and $492.3 billion at December 31,
2012 and 2011.
(2) Represents the economic capital assigned to All Other as well as the remaining portion of equity not specifically allocated to the business segments. Allocated equity increased due to the disposition
of certain assets, as previously disclosed.
n/m = not meaningful
All Other consists of ALM activities, equity investments,
liquidating businesses and other. ALM activities encompass the
whole-loan residential mortgage portfolio and investment
securities, interest rate and foreign currency risk management
activities including the residual net interest income allocation,
gains/losses on structured liabilities, and the impact of certain
allocation methodologies and accounting hedge ineffectiveness.
For more information on our ALM activities, see Interest Rate Risk
Management for Nontrading Activities on page 113. Equity
investments include Global Principal Investments (GPI) which is
comprised of a diversified portfolio of equity, real estate and other
alternative investments. These investments are made either
directly in a company or held through a fund with related income
recorded in equity investment income. Equity investments also
include strategic investments, which include our investment in CCB
in which we currently hold approximately one percent of the
outstanding common shares, and certain other investments. Other
includes certain residential mortgage and discontinued real estate
loans that are managed by Legacy Assets & Servicing. In 2012,
the Corporation entered into an agreement to sell the GWIM IWM
businesses based outside of the U.S. and sold its Japanese
brokerage joint venture. As a result of these actions, the IWM
businesses and the Japanese brokerage joint venture results were
moved from GWIM to All Other and the prior periods have been
reclassified.