Bank of America 2012 Annual Report Download - page 51
Download and view the complete annual report
Please find page 51 of the 2012 Bank of America annual report below. You can navigate through the pages in the report by either clicking on the pages listed below, or by using the keyword search tool below to find specific information within the annual report.-
 1
1 -
2
-
3
-
4
-
5
-
6
-
7
-
8
-
9
-
10
-
11
-
12
-
13
-
14
-
15
-
16
-
17
-
18
-
19
-
20
-
21
-
22
-
23
-
24
-
25
-
26
-
27
-
28
-
29
-
30
-
31
-
32
-
33
-
34
-
35
-
36
-
37
-
38
-
39
-
40
-
 41
41 -
 42
42 -
 43
43 -
 44
44 -
 45
45 -
 46
46 -
 47
47 -
 48
48 -
 49
49 -
 50
50 -
 51
51 -
 52
52 -
 53
53 -
 54
54 -
 55
55 -
 56
56 -
 57
57 -
 58
58 -
 59
59 -
 60
60 -
 61
61 -
62
-
63
-
64
-
65
-
66
-
67
-
68
-
69
-
70
-
71
-
72
-
73
-
74
-
75
-
76
-
77
-
78
-
79
-
80
-
81
-
82
-
83
-
84
-
85
-
86
-
87
-
88
-
89
-
90
-
91
-
92
-
93
-
94
-
95
-
96
-
97
-
98
-
99
-
100
-
101
-
102
-
103
-
104
-
105
-
106
-
107
-
108
-
109
-
110
-
111
-
112
-
113
-
114
-
115
-
116
-
117
-
118
-
119
-
120
-
121
-
122
-
123
-
124
-
125
-
126
-
127
-
128
-
129
-
130
-
131
-
132
-
133
-
134
-
135
-
136
-
137
-
138
-
139
-
140
-
141
-
142
-
143
-
144
-
145
-
146
-
147
-
148
-
149
-
150
-
151
-
152
-
153
-
154
-
155
-
156
-
157
-
158
-
159
-
160
-
161
-
162
-
163
-
164
-
165
-
166
-
167
-
168
-
169
-
170
-
171
-
172
-
173
-
174
-
175
-
176
-
177
-
178
-
179
-
180
-
181
-
182
-
183
-
184
-
185
-
186
-
187
-
188
-
189
-
190
-
191
-
192
-
193
-
194
-
195
-
196
-
197
-
198
-
199
-
200
-
201
-
202
-
203
-
204
-
205
-
206
-
207
-
208
-
209
-
210
-
211
-
212
-
213
-
214
-
215
-
216
-
217
-
218
-
219
-
220
-
221
-
222
-
223
-
224
-
225
-
226
-
227
-
228
-
229
-
230
-
231
-
232
-
233
-
234
-
235
-
236
-
237
-
238
-
239
-
240
-
241
-
242
-
243
-
244
-
245
-
246
-
247
-
248
-
249
-
250
-
251
-
252
-
253
-
254
-
255
-
256
-
257
-
258
-
259
-
260
-
261
-
262
-
263
-
264
-
265
-
266
-
267
-
268
-
269
-
270
-
271
-
272
-
273
-
274
-
275
-
276
-
277
-
278
-
279
-
280
-
281
-
282
-
283
-
284
 |
 |

Bank of America 2012 49
The net loss for All Other of $3.6 billion in 2012 compared to
net income of $4.7 billion in 2011 was primarily due to negative
fair value adjustments on structured liabilities of $5.1 billion
related to the improvement in our credit spreads during 2012
compared to $3.3 billion of positive fair value adjustments in 2011,
a $6.0 billion decrease in equity investment income and $1.6
billion of lower gains on sales of debt securities. Partially offsetting
these items were a $3.6 billion reduction in the provision for credit
losses, $1.6 billion of net gains resulting from repurchases of
certain debt and trust preferred securities in 2012 and a net
income tax benefit of $1.7 billion related to the recognition of
certain foreign tax credits. Equity investment income decreased
as 2011 included a $6.5 billion gain on the sale of a portion of
our investment in CCB, an $836 million CCB dividend and a $377
million gain on the sale of our investment in BlackRock. Partially
offsetting these items were an impairment write-down of $1.1
billion on our merchant services joint venture in 2011 and a $370
million gain related to the sale of the Japanese brokerage joint
venture in 2012.
The provision for credit losses decreased $3.6 billion to $2.6
billion in 2012 primarily driven by continued improvement in credit
quality in the residential mortgage portfolio and reserve reductions
in 2012 compared to reserve additions in 2011 in the Countrywide
PCI discontinued real estate and residential mortgage portfolios
driven by an improved home price outlook.
All other noninterest expense increased $1.1 billion to $6.1
billion due to higher litigation expense primarily related to the costs
associated with the settlement of a class action lawsuit during
2012 brought on behalf of investors who purchased or held Bank
of America equity securities at the time we announced plans to
acquire Merrill Lynch and other litigation, partially offset by a
decrease in personnel expense. Excluding litigation expense, all
other noninterest expense decreased compared to 2011. There
were no merger and restructuring expenses for 2012 compared
to $638 million in 2011. A goodwill impairment charge of $581
million was recorded during 2011 as a result of a change in the
estimated value of the European consumer card business.
The income tax benefit was $5.9 billion in 2012 compared to
a benefit of $1.0 billion in 2011. Included in the income tax benefit
for 2012 was a $1.7 billion tax benefit attributable to the excess
of foreign tax credits recognized in the U.S. upon repatriation of
the earnings of certain subsidiaries over the related U.S. tax
liability, and 2011 included the release of a valuation allowance
applicable to a Merrill Lynch capital loss carryforward deferred tax
asset.
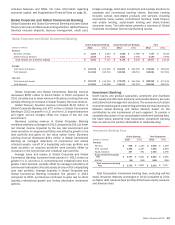
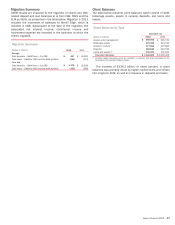
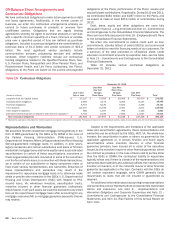
The tables below present the components of equity investments
in All Other at December 31, 2012 and 2011, and also a
reconciliation to the total consolidated equity investment income
for 2012 and 2011.
Equity Investments
December 31
(Dollars in millions) 2012 2011
Global Principal Investments $ 3,470 $ 5,659
Strategic and other investments 2,038 1,439
Total equity investments included in All Other $ 5,508 $ 7,098
Equity Investment Income
(Dollars in millions) 2012 2011
Global Principal Investments $ 589 $ 399
Strategic and other investments 546 6,706
Total equity investment income included in All
Other 1,135 7,105
Total equity investment income included in the
business segments 935 255
Total consolidated equity investment income $ 2,070 $ 7,360
Equity investments included in All Other decreased $1.6 billion
to $5.5 billion during 2012, with the decrease due to sales in the
GPI portfolio. In connection with the Corporation’s strategy to
reduce risk-weighted assets, we sold certain investments,
including related commitments. GPI had unfunded equity
commitments of $224 million at December 31, 2012 compared
to $710 million at December 31, 2011. The increase in equity
investment income in the business segments for 2012 was
primarily driven by gains on the sale of an equity investment in
Global Markets.
At December 31, 2012 and 2011, we owned 2.0 billion shares
representing approximately one percent of CCB. Sales restrictions
on these shares continue until August 2013. Because the sales
restrictions on these shares will expire within one year, these
securities are accounted for as AFS marketable equity securities
and are carried at fair value with the after-tax unrealized gain
reflected in accumulated OCI. As a result, a pre-tax unrealized gain
of $718 million, or $452 million after-tax, was reflected in
accumulated OCI. At December 31, 2012, the cost basis was
$716 million and the carrying value and the fair value were $1.4
billion. During 2011, we sold 23.6 billion common shares of our
investment in CCB and recorded a pre-tax gain of $6.5 billion. For
additional information, see Note 4 – Securities to the Consolidated
Financial Statements.