Bank of America 2012 Annual Report Download - page 120
Download and view the complete annual report
Please find page 120 of the 2012 Bank of America annual report below. You can navigate through the pages in the report by either clicking on the pages listed below, or by using the keyword search tool below to find specific information within the annual report.-
 1
1 -
2
-
3
-
4
-
5
-
6
-
7
-
8
-
9
-
10
-
11
-
12
-
13
-
14
-
15
-
16
-
17
-
18
-
19
-
20
-
21
-
22
-
23
-
24
-
25
-
26
-
27
-
28
-
29
-
30
-
31
-
32
-
33
-
34
-
35
-
36
-
37
-
38
-
39
-
40
-
41
-
42
-
43
-
44
-
45
-
46
-
47
-
48
-
49
-
50
-
51
-
52
-
53
-
54
-
55
-
56
-
57
-
58
-
59
-
60
-
61
-
62
-
63
-
64
-
65
-
66
-
67
-
68
-
69
-
70
-
71
-
72
-
73
-
74
-
75
-
76
-
77
-
78
-
79
-
80
-
81
-
82
-
83
-
84
-
85
-
86
-
87
-
88
-
89
-
90
-
91
-
92
-
93
-
94
-
95
-
96
-
97
-
98
-
99
-
100
-
101
-
102
-
103
-
104
-
105
-
106
-
107
-
108
-
109
-
 110
110 -
 111
111 -
 112
112 -
 113
113 -
 114
114 -
 115
115 -
 116
116 -
 117
117 -
 118
118 -
 119
119 -
 120
120 -
 121
121 -
 122
122 -
 123
123 -
 124
124 -
 125
125 -
 126
126 -
 127
127 -
 128
128 -
 129
129 -
 130
130 -
131
-
132
-
133
-
134
-
135
-
136
-
137
-
138
-
139
-
140
-
141
-
142
-
143
-
144
-
145
-
146
-
147
-
148
-
149
-
150
-
151
-
152
-
153
-
154
-
155
-
156
-
157
-
158
-
159
-
160
-
161
-
162
-
163
-
164
-
165
-
166
-
167
-
168
-
169
-
170
-
171
-
172
-
173
-
174
-
175
-
176
-
177
-
178
-
179
-
180
-
181
-
182
-
183
-
184
-
185
-
186
-
187
-
188
-
189
-
190
-
191
-
192
-
193
-
194
-
195
-
196
-
197
-
198
-
199
-
200
-
201
-
202
-
203
-
204
-
205
-
206
-
207
-
208
-
209
-
210
-
211
-
212
-
213
-
214
-
215
-
216
-
217
-
218
-
219
-
220
-
221
-
222
-
223
-
224
-
225
-
226
-
227
-
228
-
229
-
230
-
231
-
232
-
233
-
234
-
235
-
236
-
237
-
238
-
239
-
240
-
241
-
242
-
243
-
244
-
245
-
246
-
247
-
248
-
249
-
250
-
251
-
252
-
253
-
254
-
255
-
256
-
257
-
258
-
259
-
260
-
261
-
262
-
263
-
264
-
265
-
266
-
267
-
268
-
269
-
270
-
271
-
272
-
273
-
274
-
275
-
276
-
277
-
278
-
279
-
280
-
281
-
282
-
283
-
284
 |
 |
118 Bank of America 2012
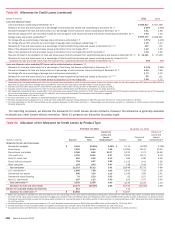
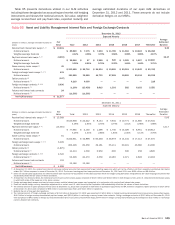
losses. Our process for determining the allowance for credit losses
is discussed in Note 1 – Summary of Significant Accounting
Principles to the Consolidated Financial Statements. We evaluate
our allowance at the portfolio segment level and our portfolio
segments are Home Loans, Credit Card and Other Consumer, and
Commercial. Due to the variability in the drivers of the assumptions
used in this process, estimates of the portfolio’s inherent risks
and overall collectability change with changes in the economy,
individual industries, countries, and borrowers’ ability and
willingness to repay their obligations. The degree to which any
particular assumption affects the allowance for credit losses
depends on the severity of the change and its relationship to the
other assumptions.
Key judgments used in determining the allowance for credit
losses include risk ratings for pools of commercial loans and
leases, market and collateral values and discount rates for
individually evaluated loans, product type classifications for
consumer and commercial loans and leases, loss rates used for
consumer and commercial loans and leases, adjustments made
to address current events and conditions, considerations
regarding domestic and global economic uncertainty, and overall
credit conditions.
Our estimate for the allowance for loan and lease losses is
sensitive to the loss rates and expected cash flows from our Home
Loans and Credit Card and Other Consumer portfolio segments,
as well as our U.S. small business commercial portfolio within the
Commercial portfolio segment. For each one percent increase in
the loss rates on loans collectively evaluated for impairment in
our Home Loans portfolio segment, excluding PCI loans, coupled
with a one percent decrease in the discounted cash flows on those
loans individually evaluated for impairment within this portfolio
segment, the allowance for loan and lease losses at December 31,
2012 would have increased by $147 million. PCI loans within our
Home Loans portfolio segment are initially recorded at fair value.
Applicable accounting guidance prohibits carry-over or creation of
valuation allowances in the initial accounting. However,
subsequent decreases in the expected cash flows from the date
of acquisition result in a charge to the provision for credit losses
and a corresponding increase to the allowance for loan and lease
losses. We subject our PCI portfolio to stress scenarios to evaluate
the potential impact given certain events. A one percent decrease
in the expected cash flows could result in a $208 million
impairment of the portfolio, of which $99 million would be related
to our discontinued real estate portfolio. For each one percent
increase in the loss rates on loans collectively evaluated for
impairment within our Credit Card and Other Consumer portfolio
segment and U.S. small business commercial portfolio coupled
with a one percent decrease in the expected cash flows on those
loans individually evaluated for impairment within the portfolio
segment and the U.S. small business commercial portfolio, the
allowance for loan and lease losses at December 31, 2012 would
have increased by $60 million.
Our allowance for loan and lease losses is sensitive to the risk
ratings assigned to loans and leases within the Commercial
portfolio segment (excluding the U.S. small business commercial
portfolio). Assuming a downgrade of one level in the internal risk
ratings for commercial loans and leases, except loans and leases
already risk-rated Doubtful as defined by regulatory authorities,
the allowance for loan and lease losses would have increased by
$2.2 billion at December 31, 2012.
The allowance for loan and lease losses as a percentage of
total loans and leases at December 31, 2012 was 2.69 percent
and these hypothetical increases in the allowance would raise the
ratio to 2.98 percent.
These sensitivity analyses do not represent management’s
expectations of the deterioration in risk ratings or the increases
in loss rates but are provided as hypothetical scenarios to assess
the sensitivity of the allowance for loan and lease losses to
changes in key inputs. We believe the risk ratings and loss
severities currently in use are appropriate and that the probability
of the alternative scenarios outlined above occurring within a short
period of time is remote.
The process of determining the level of the allowance for credit
losses requires a high degree of judgment. It is possible that
others, given the same information, may at any point in time reach
different reasonable conclusions.
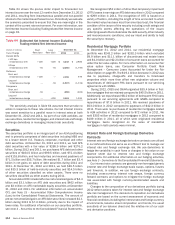
Mortgage Servicing Rights
MSRs are nonfinancial assets that are created when a mortgage
loan is sold and we retain the right to service the loan. We account
for consumer MSRs at fair value with changes in fair value recorded
in the Corporation’s Consolidated Statement of Income in
mortgage banking income (loss). Commercial and residential
reverse mortgage MSRs are accounted for using the amortization
method, lower of cost or market value, with impairment recognized
as a reduction of mortgage banking income (loss). At
December 31, 2012, our total MSR balance was $5.9 billion.
We determine the fair value of our consumer MSRs using a
valuation model that calculates the present value of estimated
future net servicing income. The model incorporates key economic
assumptions including estimates of prepayment rates and
resultant weighted-average lives of the MSRs, and the option-
adjusted spread levels. These variables can, and generally do,
change from quarter to quarter as market conditions and projected
interest rates change. These assumptions are subjective in nature
and changes in these assumptions could materially affect our
operating results. For example, decreasing the prepayment rate
assumption used in the valuation of our consumer MSRs by
10 percent while keeping all other assumptions unchanged could
have resulted in an estimated increase of $510 million in MSRs
and mortgage banking income (loss) at December 31, 2012. This
impact does not reflect any hedge strategies that may be
undertaken to mitigate such risk.
We manage potential changes in the fair value of MSRs through
a comprehensive risk management program. The intent is to
mitigate the effects of changes in the fair value of MSRs through
the use of risk management instruments. To reduce the sensitivity
of earnings to interest rate and market value fluctuations,
securities including MBS and U.S. Treasuries, as well as certain
derivatives such as options and interest rate swaps may be used
to hedge certain market risks of the MSRs, but are not designated
as accounting hedges. These instruments are carried at fair value
with changes in fair value recognized in mortgage banking income
(loss). For more information, see Mortgage Banking Risk
Management on page 116.
For additional information on MSRs, including the sensitivity of
weighted-average lives and the fair value of MSRs to changes in
modeled assumptions, see Note 24 – Mortgage Servicing Rights
to the Consolidated Financial Statements.