Bank of America 2012 Annual Report Download - page 114
Download and view the complete annual report
Please find page 114 of the 2012 Bank of America annual report below. You can navigate through the pages in the report by either clicking on the pages listed below, or by using the keyword search tool below to find specific information within the annual report.-
 1
1 -
2
-
3
-
4
-
5
-
6
-
7
-
8
-
9
-
10
-
11
-
12
-
13
-
14
-
15
-
16
-
17
-
18
-
19
-
20
-
21
-
22
-
23
-
24
-
25
-
26
-
27
-
28
-
29
-
30
-
31
-
32
-
33
-
34
-
35
-
36
-
37
-
38
-
39
-
40
-
41
-
42
-
43
-
44
-
45
-
46
-
47
-
48
-
49
-
50
-
51
-
52
-
53
-
54
-
55
-
56
-
57
-
58
-
59
-
60
-
61
-
62
-
63
-
64
-
65
-
66
-
67
-
68
-
69
-
70
-
71
-
72
-
73
-
74
-
75
-
76
-
77
-
78
-
79
-
80
-
81
-
82
-
83
-
84
-
85
-
86
-
87
-
88
-
89
-
90
-
91
-
92
-
93
-
94
-
95
-
96
-
97
-
98
-
99
-
100
-
101
-
102
-
103
-
 104
104 -
 105
105 -
 106
106 -
 107
107 -
 108
108 -
 109
109 -
 110
110 -
 111
111 -
 112
112 -
 113
113 -
 114
114 -
 115
115 -
 116
116 -
 117
117 -
 118
118 -
 119
119 -
 120
120 -
 121
121 -
 122
122 -
 123
123 -
 124
124 -
125
-
126
-
127
-
128
-
129
-
130
-
131
-
132
-
133
-
134
-
135
-
136
-
137
-
138
-
139
-
140
-
141
-
142
-
143
-
144
-
145
-
146
-
147
-
148
-
149
-
150
-
151
-
152
-
153
-
154
-
155
-
156
-
157
-
158
-
159
-
160
-
161
-
162
-
163
-
164
-
165
-
166
-
167
-
168
-
169
-
170
-
171
-
172
-
173
-
174
-
175
-
176
-
177
-
178
-
179
-
180
-
181
-
182
-
183
-
184
-
185
-
186
-
187
-
188
-
189
-
190
-
191
-
192
-
193
-
194
-
195
-
196
-
197
-
198
-
199
-
200
-
201
-
202
-
203
-
204
-
205
-
206
-
207
-
208
-
209
-
210
-
211
-
212
-
213
-
214
-
215
-
216
-
217
-
218
-
219
-
220
-
221
-
222
-
223
-
224
-
225
-
226
-
227
-
228
-
229
-
230
-
231
-
232
-
233
-
234
-
235
-
236
-
237
-
238
-
239
-
240
-
241
-
242
-
243
-
244
-
245
-
246
-
247
-
248
-
249
-
250
-
251
-
252
-
253
-
254
-
255
-
256
-
257
-
258
-
259
-
260
-
261
-
262
-
263
-
264
-
265
-
266
-
267
-
268
-
269
-
270
-
271
-
272
-
273
-
274
-
275
-
276
-
277
-
278
-
279
-
280
-
281
-
282
-
283
-
284
 |
 |
112 Bank of America 2012
We continually review, evaluate and enhance our VaR model so
that it reflects the material risks in our trading portfolio. Changes
to the VaR model are reviewed and approved prior to
implementation and any material changes are reported to
management through the appropriate governance committees.
Nevertheless, due to the limitations previously discussed, we have
historically used the VaR model as only one of the components in
managing our trading risk and also use other techniques such as
stress testing and desk level limits. Periods of extreme market
stress influence the reliability of these techniques to varying
degrees.
The accuracy of the VaR methodology is reviewed by
backtesting which compares the VaR results from historical data
against the actual daily profit and loss. Graphic representation of
the backtesting results with additional explanation of backtesting
excesses are reported to the GMRC. Backtesting excesses occur
when trading losses exceed VaR. Senior management reviews and
evaluates the results of these tests. In periods of market stress,
the GMRC members communicate daily to discuss losses and VaR
limit excesses. As a result of this process, the businesses may
selectively reduce risk. Where economically feasible, positions are
sold or macroeconomic hedges are executed to reduce the
exposure.
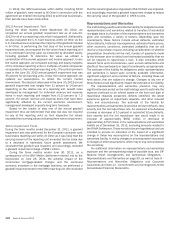
We use one VaR model that uses a historical simulation
approach based on three years of historical data and an expected
shortfall methodology equivalent to a 99 percent confidence level.
Statistically, this means that losses will exceed VaR, on average,
one out of 100 trading days, or two to three times each year. The
number of actual backtesting excesses observed is dependent on
current market performance relative to historic market volatility.
Actual losses did not exceed daily trading VaR in 2012 or 2011.
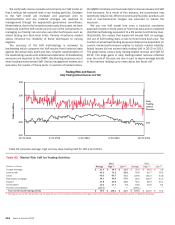
The graph below shows daily trading-related revenue and VaR for
2012. The large gains in daily trading-related revenue reflected
near the end of the year, are due in part to above average activity
in the markets leading up to news about the fiscal cliff.
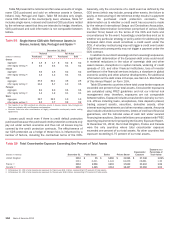
Table 62 presents average, high and low daily trading VaR for 2012 and 2011.
Table 62 Market Risk VaR for Trading Activities
2012 2011
(Dollars in millions) Average High (1) Low (1) Average High (1) Low (1)
Foreign exchange $21.4 $34.3 $11.5 $ 20.0 $ 48.6 $ 5.6
Interest rate 46.3 75.3 29.8 50.6 82.7 29.2
Credit 49.5 80.7 31.1 109.9 155.3 54.8
Real estate/mortgage 34.1 45.0 27.6 80.0 139.5 31.5
Equities 27.8 54.8 14.6 50.5 88.9 25.1
Commodities 13.0 17.7 7.2 18.9 33.8 8.4
Portfolio diversification (117.1)— —
(163.1) — —
Total market-based trading portfolio $ 75.0 $ 128.1 $ 41.9 $ 166.8 $ 318.6 $ 75.0
(1) The high and low for the total portfolio may not equal the sum of the individual components as the highs or lows of the individual portfolios may have occurred on different trading days.