Bank of America 2012 Annual Report Download - page 117
Download and view the complete annual report
Please find page 117 of the 2012 Bank of America annual report below. You can navigate through the pages in the report by either clicking on the pages listed below, or by using the keyword search tool below to find specific information within the annual report.-
 1
1 -
2
-
3
-
4
-
5
-
6
-
7
-
8
-
9
-
10
-
11
-
12
-
13
-
14
-
15
-
16
-
17
-
18
-
19
-
20
-
21
-
22
-
23
-
24
-
25
-
26
-
27
-
28
-
29
-
30
-
31
-
32
-
33
-
34
-
35
-
36
-
37
-
38
-
39
-
40
-
41
-
42
-
43
-
44
-
45
-
46
-
47
-
48
-
49
-
50
-
51
-
52
-
53
-
54
-
55
-
56
-
57
-
58
-
59
-
60
-
61
-
62
-
63
-
64
-
65
-
66
-
67
-
68
-
69
-
70
-
71
-
72
-
73
-
74
-
75
-
76
-
77
-
78
-
79
-
80
-
81
-
82
-
83
-
84
-
85
-
86
-
87
-
88
-
89
-
90
-
91
-
92
-
93
-
94
-
95
-
96
-
97
-
98
-
99
-
100
-
101
-
102
-
103
-
104
-
105
-
106
-
 107
107 -
 108
108 -
 109
109 -
 110
110 -
 111
111 -
 112
112 -
 113
113 -
 114
114 -
 115
115 -
 116
116 -
 117
117 -
 118
118 -
 119
119 -
 120
120 -
 121
121 -
 122
122 -
 123
123 -
 124
124 -
 125
125 -
 126
126 -
 127
127 -
128
-
129
-
130
-
131
-
132
-
133
-
134
-
135
-
136
-
137
-
138
-
139
-
140
-
141
-
142
-
143
-
144
-
145
-
146
-
147
-
148
-
149
-
150
-
151
-
152
-
153
-
154
-
155
-
156
-
157
-
158
-
159
-
160
-
161
-
162
-
163
-
164
-
165
-
166
-
167
-
168
-
169
-
170
-
171
-
172
-
173
-
174
-
175
-
176
-
177
-
178
-
179
-
180
-
181
-
182
-
183
-
184
-
185
-
186
-
187
-
188
-
189
-
190
-
191
-
192
-
193
-
194
-
195
-
196
-
197
-
198
-
199
-
200
-
201
-
202
-
203
-
204
-
205
-
206
-
207
-
208
-
209
-
210
-
211
-
212
-
213
-
214
-
215
-
216
-
217
-
218
-
219
-
220
-
221
-
222
-
223
-
224
-
225
-
226
-
227
-
228
-
229
-
230
-
231
-
232
-
233
-
234
-
235
-
236
-
237
-
238
-
239
-
240
-
241
-
242
-
243
-
244
-
245
-
246
-
247
-
248
-
249
-
250
-
251
-
252
-
253
-
254
-
255
-
256
-
257
-
258
-
259
-
260
-
261
-
262
-
263
-
264
-
265
-
266
-
267
-
268
-
269
-
270
-
271
-
272
-
273
-
274
-
275
-
276
-
277
-
278
-
279
-
280
-
281
-
282
-
283
-
284
 |
 |

Bank of America 2012 115
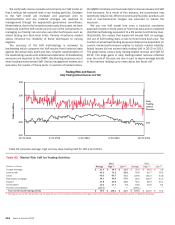
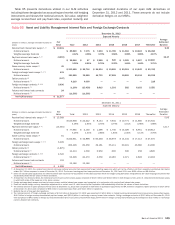
Table 65 presents derivatives utilized in our ALM activities
including those designated as accounting and market risk hedging
instruments and shows the notional amount, fair value, weighted-
average receive-fixed and pay-fixed rates, expected maturity and
average estimated durations of our open ALM derivatives at
December 31, 2012 and 2011. These amounts do not include
derivative hedges on our MSRs.
Table 65 Asset and Liability Management Interest Rate and Foreign Exchange Contracts
December 31, 2012
Expected Maturity
(Dollars in millions, average estimated duration in
years)
Fair
Value Total 2013 2014 2015 2016 2017 Thereafter
Average
Estimated
Duration
Receive-fixed interest rate swaps (1, 2) $ 10,491 5.30
Notional amount $ 85,899 $ 7,175 $ 7,604 $ 11,785 $ 11,362 $ 19,693 $ 28,280
Weighted-average fixed-rate 4.12% 4.06% 3.79%3.56%3.98%3.89%4.67%
Pay-fixed interest rate swaps (1, 2) (4,903) 15.47
Notional amount $ 26,548 $ 27 $ 3,989 $ 520 $ 1,025 $ 1,527 $ 19,460
Weighted-average fixed-rate 3.09% 6.91% 0.79%2.30%1.65%1.84%3.75%
Same-currency basis swaps (3) 45
Notional amount $ 213,458 $ 82,716 $ 54,534 $ 19,995 $ 20,361 $ 13,542 $ 22,310
Foreign exchange basis swaps (2, 4, 5) 431
Notional amount 191,925 32,590 44,732 27,569 15,965 20,134 50,935
Option products (6) (147)
Notional amount (7) 4,218 4,000 — — — — 218
Foreign exchange contracts (2, 5, 8) 5,636
Notional amount (7) (1,200) (23,438) 8,615 1,303 582 6,183 5,555
Futures and forward rate contracts 24
Notional amount (7) (11,595) (11,595) — — — ——
Net ALM contracts $ 11,577
December 31, 2011
Expected Maturity
(Dollars in millions, average estimated duration in
years)
Fair
Value Total 2012 2013 2014 2015 2016 Thereafter
Average
Estimated
Duration
Receive-fixed interest rate swaps (1, 2) $ 13,989 5.99
Notional amount $105,938 $ 22,422 $ 8,144 $ 7,604 $ 10,774 $ 11,660 $ 45,334
Weighted-average fixed-rate 4.09% 2.65% 3.70% 3.79% 4.01% 3.96% 4.98%
Pay-fixed interest rate swaps (1, 2) (13,561) 12.17
Notional amount $ 77,985 $ 2,150 $ 1,496 $ 1,750 $ 15,026 $ 8,951 $ 48,612
Weighted-average fixed-rate 3.29% 1.45% 2.68% 1.80% 2.35% 3.13% 3.76%
Same-currency basis swaps (3) 61
Notional amount $222,641 $ 44,898 $ 83,248 $ 35,678 $ 14,134 $ 17,113 $ 27,570
Foreign exchange basis swaps (2, 4, 5) 3,409
Notional amount 262,428 60,359 49,161 55,111 20,401 43,360 34,036
Option products (6) (1,875)
Notional amount (7) 10,413 1,500 2,950 600 300 458 4,605
Foreign exchange contracts (2, 5, 8) 2,522
Notional amount (7) 52,328 20,470 3,556 10,165 2,071 2,603 13,463
Futures and forward rate contracts 153
Notional amount (7) 12,16012,160—————
Net ALM contracts $4,698
(1) At December 31, 2011, the receive-fixed interest rate swap notional amounts that represented forward starting swaps and which will not be effective until their respective contractual start dates
totaled $1.7 billion compared to none at December 31, 2012. The forward starting pay-fixed swap positions at December 31, 2012 and 2011 were $520 million and $8.8 billion.
(2) Does not include basis adjustments on either fixed-rate debt issued by the Corporation or AFS debt securities which are hedged using derivatives designated as fair value hedging instruments that
substantially offset the fair values of these derivatives.
(3) At December 31, 2012 and 2011, the notional amount of same-currency basis swaps consisted of $213.5 billion and $222.6 billion in both foreign currency and U.S. dollar-denominated basis swaps
in which both sides of the swap are in the same currency.
(4) Foreign exchange basis swaps consisted of cross-currency variable interest rate swaps used separately or in conjunction with receive-fixed interest rate swaps.
(5) Does not include foreign currency translation adjustments on certain non-U.S. debt issued by the Corporation that substantially offset the fair values of these derivatives.
(6) The notional amount of option products of $4.2 billion at December 31, 2012 were comprised of $18 million in purchased caps/floors and $4.2 billion in swaptions. Option products of $10.4 billion
at December 31, 2011 were comprised of $30 million in purchased caps/floors and $10.4 billion in swaptions.
(7) Reflects the net of long and short positions.
(8) The notional amount of foreign exchange contracts of $(1.2) billion at December 31, 2012 was comprised of $41.9 billion in foreign currency-denominated and cross-currency receive-fixed swaps,
$10.5 billion in foreign currency-denominated pay-fixed swaps, and $(32.6) billion in net foreign currency forward rate contracts. Foreign exchange contracts of $52.3 billion at December 31, 2011
were comprised of $40.6 billion in foreign currency-denominated and cross-currency receive-fixed swaps, $647 million in foreign currency-denominated pay-fixed swaps and $12.4 billion in net foreign
currency forward rate contracts.