Bank of America 2012 Annual Report Download - page 198
Download and view the complete annual report
Please find page 198 of the 2012 Bank of America annual report below. You can navigate through the pages in the report by either clicking on the pages listed below, or by using the keyword search tool below to find specific information within the annual report.-
 1
1 -
2
-
3
-
4
-
5
-
6
-
7
-
8
-
9
-
10
-
11
-
12
-
13
-
14
-
15
-
16
-
17
-
18
-
19
-
20
-
21
-
22
-
23
-
24
-
25
-
26
-
27
-
28
-
29
-
30
-
31
-
32
-
33
-
34
-
35
-
36
-
37
-
38
-
39
-
40
-
41
-
42
-
43
-
44
-
45
-
46
-
47
-
48
-
49
-
50
-
51
-
52
-
53
-
54
-
55
-
56
-
57
-
58
-
59
-
60
-
61
-
62
-
63
-
64
-
65
-
66
-
67
-
68
-
69
-
70
-
71
-
72
-
73
-
74
-
75
-
76
-
77
-
78
-
79
-
80
-
81
-
82
-
83
-
84
-
85
-
86
-
87
-
88
-
89
-
90
-
91
-
92
-
93
-
94
-
95
-
96
-
97
-
98
-
99
-
100
-
101
-
102
-
103
-
104
-
105
-
106
-
107
-
108
-
109
-
110
-
111
-
112
-
113
-
114
-
115
-
116
-
117
-
118
-
119
-
120
-
121
-
122
-
123
-
124
-
125
-
126
-
127
-
128
-
129
-
130
-
131
-
132
-
133
-
134
-
135
-
136
-
137
-
138
-
139
-
140
-
141
-
142
-
143
-
144
-
145
-
146
-
147
-
148
-
149
-
150
-
151
-
152
-
153
-
154
-
155
-
156
-
157
-
158
-
159
-
160
-
161
-
162
-
163
-
164
-
165
-
166
-
167
-
168
-
169
-
170
-
171
-
172
-
173
-
174
-
175
-
176
-
177
-
178
-
179
-
180
-
181
-
182
-
183
-
184
-
185
-
186
-
187
-
 188
188 -
 189
189 -
 190
190 -
 191
191 -
 192
192 -
 193
193 -
 194
194 -
 195
195 -
 196
196 -
 197
197 -
 198
198 -
 199
199 -
 200
200 -
 201
201 -
 202
202 -
 203
203 -
 204
204 -
 205
205 -
 206
206 -
 207
207 -
 208
208 -
209
-
210
-
211
-
212
-
213
-
214
-
215
-
216
-
217
-
218
-
219
-
220
-
221
-
222
-
223
-
224
-
225
-
226
-
227
-
228
-
229
-
230
-
231
-
232
-
233
-
234
-
235
-
236
-
237
-
238
-
239
-
240
-
241
-
242
-
243
-
244
-
245
-
246
-
247
-
248
-
249
-
250
-
251
-
252
-
253
-
254
-
255
-
256
-
257
-
258
-
259
-
260
-
261
-
262
-
263
-
264
-
265
-
266
-
267
-
268
-
269
-
270
-
271
-
272
-
273
-
274
-
275
-
276
-
277
-
278
-
279
-
280
-
281
-
282
-
283
-
284
 |
 |

196 Bank of America 2012
interest rates are rare. Instead, the interest rates are typically
increased, although the increased rate may not represent a market
rate of interest. Infrequently, concessions may also include
principal forgiveness in connection with foreclosure, short sale or
other settlement agreements leading to termination or sale of the
loan.
At the time of restructuring, the loans are remeasured to reflect
the impact, if any, on projected cash flows resulting from the
modified terms. If there was no forgiveness of principal and the
interest rate was not decreased, the modification may have little
or no impact on the allowance established for the loan. If a portion
of the loan is deemed to be uncollectible, a charge-off may be
recorded at the time of restructuring. Alternatively, a charge-off
may have already been recorded in a previous period such that no
charge-off is required at the time of modification. For information
concerning modifications for the U.S. small business commercial
portfolio, see Credit Card and Other Consumer in this Note.
At December 31, 2012 and 2011, remaining commitments to
lend additional funds to debtors whose terms have been modified
in a commercial loan TDR were immaterial. Commercial foreclosed
properties totaled $250 million and $612 million at December 31,
2012 and 2011.
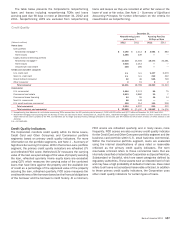
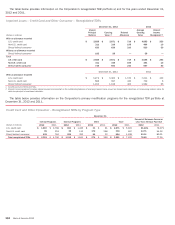
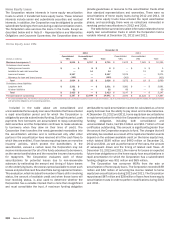
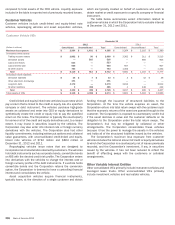
The table below presents impaired loans in the Corporation’s
Commercial loan portfolio segment at and for the years ended
December 31, 2012 and 2011. Certain impaired commercial loans
do not have a related allowance as the valuation of these impaired
loans exceeded the carrying value, which is net of previously
recorded charge-offs.
Impaired Loans – Commercial
December 31, 2012 2012
(Dollars in millions)
Unpaid
Principal
Balance
Carrying
Value
Related
Allowance
Average
Carrying
Value
Interest
Income
Recognized (1)
With no recorded allowance
U.S. commercial $ 1,220 $ 1,109 n/a $ 1,089 $ 32
Commercial real estate 1,003 902 n/a 1,496 16
Non-U.S. commercial 240 120 n/a 129 2
With an allowance recorded
U.S. commercial 1,782 1,138 $ 68 1,603 32
Commercial real estate 2,287 1,262 147 1,749 16
Non-U.S. commercial 280 33 18 52 2
U.S. small business commercial (2) 361 317 97 409 13
Total
U.S. commercial $ 3,002 $ 2,247 $ 68 $ 2,692 $ 64
Commercial real estate 3,290 2,164 147 3,245 32
Non-U.S. commercial 520 153 18 181 4
U.S. small business commercial (2) 361 317 97 409 13
December 31, 2011 2011
With no recorded allowance
U.S. commercial $ 1,482 $ 985 n/a $ 774 $ 7
Commercial real estate 2,587 2,095 n/a 1,994 7
Non-U.S. commercial 216 101 n/a 101 —
With an allowance recorded
U.S. commercial 2,654 1,987 $ 232 2,422 13
Commercial real estate 3,329 2,384 135 3,309 19
Non-U.S. commercial 308 58 6 76 3
U.S. small business commercial (2) 531 503 172 666 23
Total
U.S. commercial $ 4,136 $ 2,972 $ 232 $ 3,196 $ 20
Commercial real estate 5,916 4,479 135 5,303 26
Non-U.S. commercial 524 159 6 177 3
U.S. small business commercial (2) 531 503 172 666 23
(1) Interest income recognized includes interest accrued and collected on the outstanding balances of accruing impaired loans as well as interest cash collections on nonaccruing impaired loans for
which the principal is considered collectible.
(2) Includes U.S. small business commercial renegotiated TDR loans and related allowance.
n/a = not applicable