Bank of America 2012 Annual Report Download - page 156
Download and view the complete annual report
Please find page 156 of the 2012 Bank of America annual report below. You can navigate through the pages in the report by either clicking on the pages listed below, or by using the keyword search tool below to find specific information within the annual report.-
 1
1 -
2
-
3
-
4
-
5
-
6
-
7
-
8
-
9
-
10
-
11
-
12
-
13
-
14
-
15
-
16
-
17
-
18
-
19
-
20
-
21
-
22
-
23
-
24
-
25
-
26
-
27
-
28
-
29
-
30
-
31
-
32
-
33
-
34
-
35
-
36
-
37
-
38
-
39
-
40
-
41
-
42
-
43
-
44
-
45
-
46
-
47
-
48
-
49
-
50
-
51
-
52
-
53
-
54
-
55
-
56
-
57
-
58
-
59
-
60
-
61
-
62
-
63
-
64
-
65
-
66
-
67
-
68
-
69
-
70
-
71
-
72
-
73
-
74
-
75
-
76
-
77
-
78
-
79
-
80
-
81
-
82
-
83
-
84
-
85
-
86
-
87
-
88
-
89
-
90
-
91
-
92
-
93
-
94
-
95
-
96
-
97
-
98
-
99
-
100
-
101
-
102
-
103
-
104
-
105
-
106
-
107
-
108
-
109
-
110
-
111
-
112
-
113
-
114
-
115
-
116
-
117
-
118
-
119
-
120
-
121
-
122
-
123
-
124
-
125
-
126
-
127
-
128
-
129
-
130
-
131
-
132
-
133
-
134
-
135
-
136
-
137
-
138
-
139
-
140
-
141
-
142
-
143
-
144
-
145
-
 146
146 -
 147
147 -
 148
148 -
 149
149 -
 150
150 -
 151
151 -
 152
152 -
 153
153 -
 154
154 -
 155
155 -
 156
156 -
 157
157 -
 158
158 -
 159
159 -
 160
160 -
 161
161 -
 162
162 -
 163
163 -
 164
164 -
 165
165 -
 166
166 -
167
-
168
-
169
-
170
-
171
-
172
-
173
-
174
-
175
-
176
-
177
-
178
-
179
-
180
-
181
-
182
-
183
-
184
-
185
-
186
-
187
-
188
-
189
-
190
-
191
-
192
-
193
-
194
-
195
-
196
-
197
-
198
-
199
-
200
-
201
-
202
-
203
-
204
-
205
-
206
-
207
-
208
-
209
-
210
-
211
-
212
-
213
-
214
-
215
-
216
-
217
-
218
-
219
-
220
-
221
-
222
-
223
-
224
-
225
-
226
-
227
-
228
-
229
-
230
-
231
-
232
-
233
-
234
-
235
-
236
-
237
-
238
-
239
-
240
-
241
-
242
-
243
-
244
-
245
-
246
-
247
-
248
-
249
-
250
-
251
-
252
-
253
-
254
-
255
-
256
-
257
-
258
-
259
-
260
-
261
-
262
-
263
-
264
-
265
-
266
-
267
-
268
-
269
-
270
-
271
-
272
-
273
-
274
-
275
-
276
-
277
-
278
-
279
-
280
-
281
-
282
-
283
-
284
 |
 |

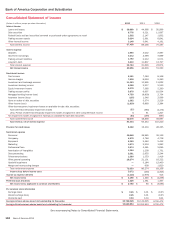
154 Bank of America 2012
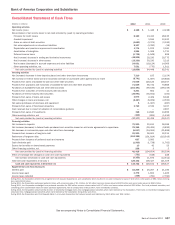
Bank of America Corporation and Subsidiaries
Consolidated Balance Sheet
December 31
(Dollars in millions) 2012 2011
Assets
Cash and cash equivalents $ 110,752 $ 120,102
Time deposits placed and other short-term investments 18,694 26,004
Federal funds sold and securities borrowed or purchased under agreements to resell (includes $98,670 and $87,453 measured at fair
value) 219,924 211,183
Trading account assets (includes $115,821 and $80,130 pledged as collateral) 237,226 169,319
Derivative assets 53,497 73,023
Debt securities:
Available-for-sale (includes $63,342 and $69,021 pledged as collateral) 286,906 276,151
Held-to-maturity, at cost (fair value – $50,270 and $35,442; $22,461 and $24,009 pledged as collateral) 49,481 35,265
Total debt securities 336,387 311,416
Loans and leases (includes $9,002 and $8,804 measured at fair value and $50,289 and $73,463 pledged as collateral) 907,819 926,200
Allowance for loan and lease losses (24,179) (33,783)
Loans and leases, net of allowance 883,640 892,417
Premises and equipment, net 11,858 13,637
Mortgage servicing rights (includes $5,716 and $7,378 measured at fair value) 5,851 7,510
Goodwill 69,976 69,967
Intangible assets 6,684 8,021
Loans held-for-sale (includes $11,659 and $7,630 measured at fair value) 19,413 13,762
Customer and other receivables 71,467 66,999
Other assets (includes $40,983 and $37,084 measured at fair value) 164,605 145,686
Total assets $ 2,209,974 $ 2,129,046
Assets of consolidated variable interest entities included in total assets above (isolated to settle the liabilities of the variable interest entities)
Trading account assets $ 7,906 $ 8,595
Derivative assets 333 1,634
Loans and leases 123,227 140,194
Allowance for loan and lease losses (3,658)(5,066)
Loans and leases, net of allowance 119,569 135,128
Loans held-for-sale 1,969 1,635
All other assets 4,654 4,769
Total assets of consolidated variable interest entities $ 134,431 $ 151,761
See accompanying Notes to Consolidated Financial Statements.