Bank of America 2012 Annual Report Download - page 245
Download and view the complete annual report
Please find page 245 of the 2012 Bank of America annual report below. You can navigate through the pages in the report by either clicking on the pages listed below, or by using the keyword search tool below to find specific information within the annual report.-
 1
1 -
2
-
3
-
4
-
5
-
6
-
7
-
8
-
9
-
10
-
11
-
12
-
13
-
14
-
15
-
16
-
17
-
18
-
19
-
20
-
21
-
22
-
23
-
24
-
25
-
26
-
27
-
28
-
29
-
30
-
31
-
32
-
33
-
34
-
35
-
36
-
37
-
38
-
39
-
40
-
41
-
42
-
43
-
44
-
45
-
46
-
47
-
48
-
49
-
50
-
51
-
52
-
53
-
54
-
55
-
56
-
57
-
58
-
59
-
60
-
61
-
62
-
63
-
64
-
65
-
66
-
67
-
68
-
69
-
70
-
71
-
72
-
73
-
74
-
75
-
76
-
77
-
78
-
79
-
80
-
81
-
82
-
83
-
84
-
85
-
86
-
87
-
88
-
89
-
90
-
91
-
92
-
93
-
94
-
95
-
96
-
97
-
98
-
99
-
100
-
101
-
102
-
103
-
104
-
105
-
106
-
107
-
108
-
109
-
110
-
111
-
112
-
113
-
114
-
115
-
116
-
117
-
118
-
119
-
120
-
121
-
122
-
123
-
124
-
125
-
126
-
127
-
128
-
129
-
130
-
131
-
132
-
133
-
134
-
135
-
136
-
137
-
138
-
139
-
140
-
141
-
142
-
143
-
144
-
145
-
146
-
147
-
148
-
149
-
150
-
151
-
152
-
153
-
154
-
155
-
156
-
157
-
158
-
159
-
160
-
161
-
162
-
163
-
164
-
165
-
166
-
167
-
168
-
169
-
170
-
171
-
172
-
173
-
174
-
175
-
176
-
177
-
178
-
179
-
180
-
181
-
182
-
183
-
184
-
185
-
186
-
187
-
188
-
189
-
190
-
191
-
192
-
193
-
194
-
195
-
196
-
197
-
198
-
199
-
200
-
201
-
202
-
203
-
204
-
205
-
206
-
207
-
208
-
209
-
210
-
211
-
212
-
213
-
214
-
215
-
216
-
217
-
218
-
219
-
220
-
221
-
222
-
223
-
224
-
225
-
226
-
227
-
228
-
229
-
230
-
231
-
232
-
233
-
234
-
 235
235 -
 236
236 -
 237
237 -
 238
238 -
 239
239 -
 240
240 -
 241
241 -
 242
242 -
 243
243 -
 244
244 -
 245
245 -
 246
246 -
 247
247 -
 248
248 -
 249
249 -
 250
250 -
 251
251 -
 252
252 -
 253
253 -
 254
254 -
 255
255 -
256
-
257
-
258
-
259
-
260
-
261
-
262
-
263
-
264
-
265
-
266
-
267
-
268
-
269
-
270
-
271
-
272
-
273
-
274
-
275
-
276
-
277
-
278
-
279
-
280
-
281
-
282
-
283
-
284
 |
 |

Bank of America 2012 243
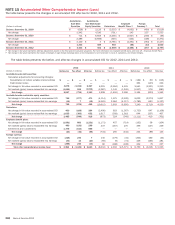
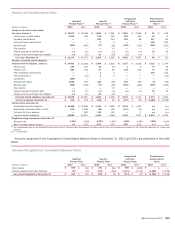
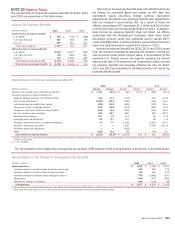
Pension and Postretirement Plans
Qualified
Pension Plans (1)
Non-U.S.
Pension Plans (1)
Nonqualified
and Other
Pension Plans (1)
Postretirement
Health and Life
Plans (1)
(Dollars in millions) 2012 2011 2012 2011 2012 2011 2012 2011
Change in fair value of plan assets
Fair value, January 1 $ 15,070 $ 15,648 $ 2,022 $ 1,691 $ 3,061 $ 2,689 $91 $ 108
Actual return on plan assets 2,020 182 115 295 126 493 10 2
Company contributions ——152 104 112 99 117 84
Plan participant contributions ——33——139 133
Benefits paid (816) (760) (77) (63) (236) (220) (290)(255)
Plan transfer ———10 ————
Federal subsidy on benefits paid n/a n/a n/a n/a n/a n/a 19 19
Foreign currency exchange rate changes n/a n/a 91 (18) n/a n/a ——
Fair value, December 31 $ 16,274 $ 15,070 $ 2,306 $ 2,022 $ 3,063 $ 3,061 $86 $91
Change in projected benefit obligation
Projected benefit obligation, January 1 $ 14,891 $ 13,938 $ 1,984 $ 1,916 $ 3,137 $ 3,078 $ 1,619 $1,704
Service cost 236 423 40 43 1313 15
Interest cost 681 746 97 99 138 152 71 80
Plan participant contributions ——33——139 133
Plan amendments —(11) 22———(21)
Curtailment (889) ———————
Actuarial loss (gain) 1,552 555 328 (19) 294 124 (4)(56)
Benefits paid (816) (760) (77) (63) (236) (220) (290)(255)
Plan transfer ———15 ————
Federal subsidy on benefits paid n/a n/a n/a n/a n/a n/a 19 19
Foreign currency exchange rate changes n/a n/a 83 (12) ——7—
Projected benefit obligation, December 31 $ 15,655 $ 14,891 $ 2,460 $ 1,984 $ 3,334 $ 3,137 $ 1,574 $1,619
Amount recognized, December 31 $ 619 $ 179 $ (154) $ 38 $ (271) $ (76) $(1,488)$ (1,528)
Funded status, December 31
Accumulated benefit obligation $ 15,655 $ 13,968 $ 2,345 $ 1,883 $ 3,334 $ 3,135 n/a n/a
Overfunded (unfunded) status of ABO 619 1,102 (39) 139 (271) (74) n/a n/a
Provision for future salaries —923 115 101 —2n/a n/a
Projected benefit obligation 15,655 14,891 2,460 1,984 3,334 3,137 $ 1,574 $1,619
Weighted-average assumptions, December 31
Discount rate 4.00% 4.95% 4.23%4.87% 3.65%4.65% 3.65%4.65%
Rate of compensation increase n/a 4.00 4.37 4.42 4.00 4.00 n/a n/a
(1) The measurement date for the Qualified Pension Plans, Non-U.S. Pension Plans, Nonqualified and Other Pension Plans, and Postretirement Health and Life Plans was December 31 of each year
reported.
n/a = not applicable
Amounts recognized in the Corporation’s Consolidated Balance Sheet at December 31, 2012 and 2011 are presented in the table
below.
Amounts Recognized on Consolidated Balance Sheet
Qualified
Pension Plans
Non-U.S.
Pension Plans
Nonqualified
and Other
Pension Plans
Postretirement
Health and Life
Plans
(Dollars in millions) 2012 2011 2012 2011 2012 2011 2012 2011
Other assets $ 676 $ 246 $220 $ 342 $908 $ 1,096 $—$—
Accrued expenses and other liabilities (57) (67) (374) (304) (1,179)(1,172) (1,488)(1,528)
Net amount recognized at December 31 $ 619 $ 179 $ (154) $ 38 $ (271) $ (76) $(1,488)$ (1,528)