Bank of America 2012 Annual Report Download - page 182
Download and view the complete annual report
Please find page 182 of the 2012 Bank of America annual report below. You can navigate through the pages in the report by either clicking on the pages listed below, or by using the keyword search tool below to find specific information within the annual report.-
 1
1 -
2
-
3
-
4
-
5
-
6
-
7
-
8
-
9
-
10
-
11
-
12
-
13
-
14
-
15
-
16
-
17
-
18
-
19
-
20
-
21
-
22
-
23
-
24
-
25
-
26
-
27
-
28
-
29
-
30
-
31
-
32
-
33
-
34
-
35
-
36
-
37
-
38
-
39
-
40
-
41
-
42
-
43
-
44
-
45
-
46
-
47
-
48
-
49
-
50
-
51
-
52
-
53
-
54
-
55
-
56
-
57
-
58
-
59
-
60
-
61
-
62
-
63
-
64
-
65
-
66
-
67
-
68
-
69
-
70
-
71
-
72
-
73
-
74
-
75
-
76
-
77
-
78
-
79
-
80
-
81
-
82
-
83
-
84
-
85
-
86
-
87
-
88
-
89
-
90
-
91
-
92
-
93
-
94
-
95
-
96
-
97
-
98
-
99
-
100
-
101
-
102
-
103
-
104
-
105
-
106
-
107
-
108
-
109
-
110
-
111
-
112
-
113
-
114
-
115
-
116
-
117
-
118
-
119
-
120
-
121
-
122
-
123
-
124
-
125
-
126
-
127
-
128
-
129
-
130
-
131
-
132
-
133
-
134
-
135
-
136
-
137
-
138
-
139
-
140
-
141
-
142
-
143
-
144
-
145
-
146
-
147
-
148
-
149
-
150
-
151
-
152
-
153
-
154
-
155
-
156
-
157
-
158
-
159
-
160
-
161
-
162
-
163
-
164
-
165
-
166
-
167
-
168
-
169
-
170
-
171
-
 172
172 -
 173
173 -
 174
174 -
 175
175 -
 176
176 -
 177
177 -
 178
178 -
 179
179 -
 180
180 -
 181
181 -
 182
182 -
 183
183 -
 184
184 -
 185
185 -
 186
186 -
 187
187 -
 188
188 -
 189
189 -
 190
190 -
 191
191 -
 192
192 -
193
-
194
-
195
-
196
-
197
-
198
-
199
-
200
-
201
-
202
-
203
-
204
-
205
-
206
-
207
-
208
-
209
-
210
-
211
-
212
-
213
-
214
-
215
-
216
-
217
-
218
-
219
-
220
-
221
-
222
-
223
-
224
-
225
-
226
-
227
-
228
-
229
-
230
-
231
-
232
-
233
-
234
-
235
-
236
-
237
-
238
-
239
-
240
-
241
-
242
-
243
-
244
-
245
-
246
-
247
-
248
-
249
-
250
-
251
-
252
-
253
-
254
-
255
-
256
-
257
-
258
-
259
-
260
-
261
-
262
-
263
-
264
-
265
-
266
-
267
-
268
-
269
-
270
-
271
-
272
-
273
-
274
-
275
-
276
-
277
-
278
-
279
-
280
-
281
-
282
-
283
-
284
 |
 |

180 Bank of America 2012
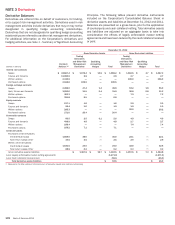
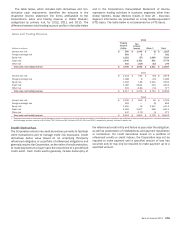
At December 31, 2012, the accumulated net unrealized gains
on AFS debt securities included in accumulated OCI were $4.4
billion, net of the related income tax expense of $2.6 billion. At
December 31, 2012 and 2011, the Corporation had
nonperforming AFS debt securities of $91 million and $140 million.
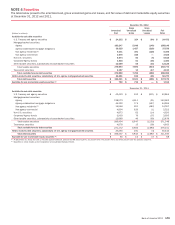
The Corporation recorded OTTI losses on AFS debt securities
for 2012, 2011 and 2010 as presented in the table below. A debt
security is impaired when its fair value is less than its amortized
cost. If the Corporation intends or will more-likely-than-not be
required to sell the debt securities prior to recovery, the entire
impairment loss is recorded in the Corporation’s Consolidated
Statement of Income. For debt securities the Corporation does
not intend or will not more-likely-than-not be required to sell, an
analysis is performed to determine if any of the impairment is due
to credit or whether it is due to other factors (e.g., interest rate).
Credit losses are considered unrecoverable and are recorded in
the Corporation’s Consolidated Statement of Income with the
remaining unrealized losses recorded in accumulated OCI. In
certain instances, the credit loss on a debt security may exceed
the total impairment, in which case, the portion of the credit loss
that exceeds the total impairment is recorded as an unrealized
gain in accumulated OCI. Balances in the table below exclude $5
million, $9 million and $51 million of unrealized gains recorded in
accumulated OCI related to these securities for 2012, 2011 and
2010, respectively.
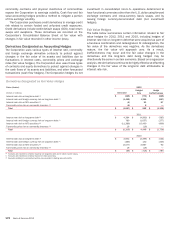
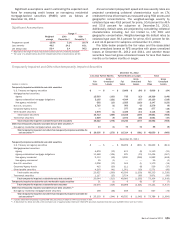
Net Impairment Losses Recognized in Earnings
2012
(Dollars in millions)
Non-agency
Residential
MBS
Non-agency
Commercial
MBS
Non-U.S.
Securities
Corporate
Bonds
Other
Taxable
Securities Total
Total OTTI losses (unrealized and realized) $ (50) $ (7) $ — $ — $ — $ (57)
Unrealized OTTI losses recognized in accumulated OCI 4———— 4
Net impairment losses recognized in earnings $ (46) $ (7) $ — $ — $ — $ (53)
2011
Total OTTI losses (unrealized and realized) $ (348) $ (10) $ — $ — $ (2) $ (360)
Unrealized OTTI losses recognized in accumulated OCI 61 ————61
Net impairment losses recognized in earnings $ (287) $ (10) $ — $ — $ (2) $ (299)
2010
Total OTTI losses (unrealized and realized) $ (1,305) $ (19) $ (276) $ (6) $ (568) $ (2,174)
Unrealized OTTI losses recognized in accumulated OCI 817 15 16 2 357 1,207
Net impairment losses recognized in earnings $ (488) $ (4) $ (260) $ (4) $ (211) $ (967)
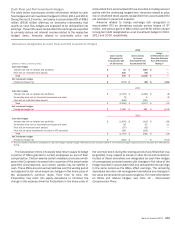
The Corporation’s net impairment losses recognized in earnings
consist of write-downs to fair value on AFS securities the
Corporation has the intent to sell or will more-likely-than-not be
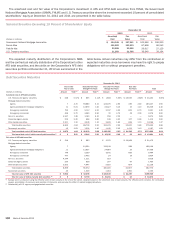
required to sell and all credit losses. The table below presents a
rollforward of the credit losses recognized in earnings in 2012,
2011 and 2010 on AFS debt securities that the Corporation does
not have the intent to sell or will not more-likely-than-not be required
to sell.
Rollforward of Credit Losses Recognized
(Dollars in millions) 2012 2011 2010
Balance, January 1 $ 310 $ 2,148 $ 3,155
Additions for credit losses recognized on debt securities that had no previous impairment losses 772 487
Additions for credit losses recognized on debt securities that had previously incurred impairment losses 46 149 421
Reductions for debt securities sold or intended to be sold (120)(2,059) (1,915)
Balance, December 31 $ 243 $ 310 $ 2,148
The Corporation estimates the portion of a loss on a security
that is attributable to credit using a discounted cash flow model
and estimates the expected cash flows of the underlying collateral
using internal credit, interest rate and prepayment risk models
that incorporate management’s best estimate of current key
assumptions such as default rates, loss severity and prepayment
rates. Assumptions used for the underlying loans that support the
MBS can vary widely from loan to loan and are influenced by such
factors as loan interest rate, geographic location of the borrower,
borrower characteristics and collateral type. Based on these
assumptions, the Corporation then determines how the underlying
collateral cash flows will be distributed to each MBS issued from
the applicable special purpose entity. Expected principal and
interest cash flows on an impaired AFS debt security are
discounted using the effective yield of each individual impaired
AFS debt security.