Bank of America 2012 Annual Report Download - page 37
Download and view the complete annual report
Please find page 37 of the 2012 Bank of America annual report below. You can navigate through the pages in the report by either clicking on the pages listed below, or by using the keyword search tool below to find specific information within the annual report.-
 1
1 -
2
-
3
-
4
-
5
-
6
-
7
-
8
-
9
-
10
-
11
-
12
-
13
-
14
-
15
-
16
-
17
-
18
-
19
-
20
-
21
-
22
-
23
-
24
-
25
-
26
-
 27
27 -
 28
28 -
 29
29 -
 30
30 -
 31
31 -
 32
32 -
 33
33 -
 34
34 -
 35
35 -
 36
36 -
 37
37 -
 38
38 -
 39
39 -
 40
40 -
 41
41 -
 42
42 -
 43
43 -
 44
44 -
 45
45 -
 46
46 -
 47
47 -
48
-
49
-
50
-
51
-
52
-
53
-
54
-
55
-
56
-
57
-
58
-
59
-
60
-
61
-
62
-
63
-
64
-
65
-
66
-
67
-
68
-
69
-
70
-
71
-
72
-
73
-
74
-
75
-
76
-
77
-
78
-
79
-
80
-
81
-
82
-
83
-
84
-
85
-
86
-
87
-
88
-
89
-
90
-
91
-
92
-
93
-
94
-
95
-
96
-
97
-
98
-
99
-
100
-
101
-
102
-
103
-
104
-
105
-
106
-
107
-
108
-
109
-
110
-
111
-
112
-
113
-
114
-
115
-
116
-
117
-
118
-
119
-
120
-
121
-
122
-
123
-
124
-
125
-
126
-
127
-
128
-
129
-
130
-
131
-
132
-
133
-
134
-
135
-
136
-
137
-
138
-
139
-
140
-
141
-
142
-
143
-
144
-
145
-
146
-
147
-
148
-
149
-
150
-
151
-
152
-
153
-
154
-
155
-
156
-
157
-
158
-
159
-
160
-
161
-
162
-
163
-
164
-
165
-
166
-
167
-
168
-
169
-
170
-
171
-
172
-
173
-
174
-
175
-
176
-
177
-
178
-
179
-
180
-
181
-
182
-
183
-
184
-
185
-
186
-
187
-
188
-
189
-
190
-
191
-
192
-
193
-
194
-
195
-
196
-
197
-
198
-
199
-
200
-
201
-
202
-
203
-
204
-
205
-
206
-
207
-
208
-
209
-
210
-
211
-
212
-
213
-
214
-
215
-
216
-
217
-
218
-
219
-
220
-
221
-
222
-
223
-
224
-
225
-
226
-
227
-
228
-
229
-
230
-
231
-
232
-
233
-
234
-
235
-
236
-
237
-
238
-
239
-
240
-
241
-
242
-
243
-
244
-
245
-
246
-
247
-
248
-
249
-
250
-
251
-
252
-
253
-
254
-
255
-
256
-
257
-
258
-
259
-
260
-
261
-
262
-
263
-
264
-
265
-
266
-
267
-
268
-
269
-
270
-
271
-
272
-
273
-
274
-
275
-
276
-
277
-
278
-
279
-
280
-
281
-
282
-
283
-
284
 |
 |

Bank of America 2012 35
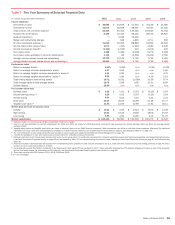
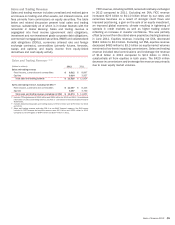
Deposits
Deposits includes the results of consumer deposit activities which
consist of a comprehensive range of products provided to
consumers and small businesses. Our deposit products include
traditional savings accounts, money market savings accounts, CDs
and IRAs, noninterest- and interest-bearing checking accounts, as
well as investment accounts and products. Deposit products
provide a relatively stable source of funding and liquidity for the
Corporation. We earn net interest spread revenue from investing
this liquidity in earning assets through client-facing lending and
ALM activities. The revenue is allocated to the deposit products
using our funds transfer pricing process that matches assets and
liabilities with similar interest rate sensitivity and maturity
characteristics.
Deposits also generates fees such as account service fees,
non-sufficient funds fees, overdraft charges and ATM fees, as well
as investment and brokerage fees from Merrill Edge accounts.
Merrill Edge is an integrated investing and banking service targeted
at clients with less than $250,000 in investable assets. Merrill
Edge provides investment advice and guidance, brokerage
services, a self-directed online investing platform and key banking
capabilities including access to the Corporation’s network of
banking centers and ATMs. Deposits includes the net impact of
migrating customers and their related deposit balances between
Deposits and GWIM as well as other client-managed businesses.
For more information on the migration of customer balances to or
from GWIM, see GWIM on page 46.
Net income for Deposits decreased $300 million to $917
million in 2012 primarily driven by lower net interest income,
partially offset by lower noninterest expense. Net interest income
declined $615 million to $7.9 billion driven by compressed deposit
spreads due to the continued low rate environment, partially offset
by growth in deposit balances, a customer shift to higher spread
liquid products and continued pricing discipline. Noninterest
income of $4.2 billion remained relatively unchanged. Noninterest
expense decreased $191 million to $10.4 billion as lower FDIC
expense was partially offset by higher operating and litigation
expenses.
Average deposits increased $13.2 billion to $434.3 billion in
2012 driven by a customer shift to more liquid products in a low
rate environment as checking, traditional savings and money
market savings grew $23.9 billion. Growth in liquid products was
partially offset by a decline in average time deposits of $10.7
billion. As a result of the shift in the mix of deposits and our
continued pricing discipline, the rate paid on average deposits
declined by seven bps to 20 bps.
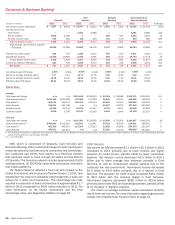
Key Statistics
2012 2011
Total deposit spreads (excludes noninterest costs) (1) 1.81% 2.12%
Year end
Client brokerage assets (in millions) $75,946 $66,576
Online banking active accounts (units in thousands) 29,638 29,870
Mobile banking active accounts (units in thousands) 12,013 9,166
Banking centers 5,478 5,702
ATMs 16,347 17,756
(1) Total deposit spreads include the Deposits and Business Banking businesses.
Mobile banking customers increased 2.8 million in 2012
reflecting a change in our customers’ banking preferences. The
number of banking centers declined 224 and ATMs declined 1,409
as we continue to improve our cost-to-serve and optimize our
consumer banking network.
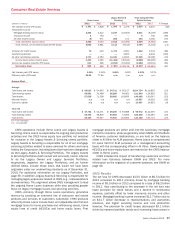
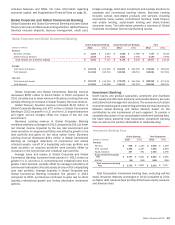
Card Services
Card Services is one of the leading issuers of credit and debit
cards to consumers and small businesses in the U.S. In addition
to earning net interest spread revenue on its lending activities,
Card Services generates interchange revenue from credit and debit
card transactions as well as annual credit card fees and other
miscellaneous fees.
Net income for Card Services decreased $1.8 billion to $4.1
billion in 2012 primarily driven by a decrease in revenue and an
increase in the provision for credit losses, partially offset by lower
noninterest expense. Net interest income decreased $1.5 billion
to $10.0 billion driven by lower average loan balances and yields.
The net interest yield decreased 11 bps to 8.93 percent due to
charge-offs and paydowns of higher interest rate products.
Noninterest income decreased $1.4 billion to $5.2 billion primarily
due to lower interchange fees as a result of implementing the
Durbin Amendment, lower gains on sales of portfolios and the
impact of charges related to our consumer protection products.
The provision for credit losses increased $380 million to $3.5
billion in 2012 as portfolio trends stabilized during 2012. For more
information, see Provision for Credit Losses on page 105.
Noninterest expense decreased $465 million to $5.5 billion
primarily due to lower personnel and operating expenses.
Average loans decreased $14.4 billion to $111.6 billion in
2012 driven by the impact of portfolio sales, charge-offs and
continued run-off of non-core portfolios.
Key Statistics
(Dollars in millions) 2012 2011
U.S. credit card
Gross interest yield 10.02% 10.25%
Risk-adjusted margin 7.54 5.81
New accounts (in thousands) 3,258 3,035
Purchase volumes $ 193,500 $192,358
Debit card purchase volumes 258,363 250,545
During 2012, the U.S. credit card risk-adjusted margin
increased 173 bps due to a decrease in net charge-offs driven by
an improvement in credit quality. U.S. credit card new accounts
grew by approximately 223,000 accounts to 3.3 million. During
2012, U.S. credit card purchase volumes increased $1.1 billion
to $193.5 billion reflecting higher levels of consumer spending,
partially offset by the impact of portfolio sales. Debit card purchase
volumes increased $7.8 billion to $258.4 billion reflecting higher
levels of consumer spending.