Bank of America 2012 Annual Report Download - page 83
Download and view the complete annual report
Please find page 83 of the 2012 Bank of America annual report below. You can navigate through the pages in the report by either clicking on the pages listed below, or by using the keyword search tool below to find specific information within the annual report.-
 1
1 -
2
-
3
-
4
-
5
-
6
-
7
-
8
-
9
-
10
-
11
-
12
-
13
-
14
-
15
-
16
-
17
-
18
-
19
-
20
-
21
-
22
-
23
-
24
-
25
-
26
-
27
-
28
-
29
-
30
-
31
-
32
-
33
-
34
-
35
-
36
-
37
-
38
-
39
-
40
-
41
-
42
-
43
-
44
-
45
-
46
-
47
-
48
-
49
-
50
-
51
-
52
-
53
-
54
-
55
-
56
-
57
-
58
-
59
-
60
-
61
-
62
-
63
-
64
-
65
-
66
-
67
-
68
-
69
-
70
-
71
-
72
-
 73
73 -
 74
74 -
 75
75 -
 76
76 -
 77
77 -
 78
78 -
 79
79 -
 80
80 -
 81
81 -
 82
82 -
 83
83 -
 84
84 -
 85
85 -
 86
86 -
 87
87 -
 88
88 -
 89
89 -
 90
90 -
 91
91 -
 92
92 -
 93
93 -
94
-
95
-
96
-
97
-
98
-
99
-
100
-
101
-
102
-
103
-
104
-
105
-
106
-
107
-
108
-
109
-
110
-
111
-
112
-
113
-
114
-
115
-
116
-
117
-
118
-
119
-
120
-
121
-
122
-
123
-
124
-
125
-
126
-
127
-
128
-
129
-
130
-
131
-
132
-
133
-
134
-
135
-
136
-
137
-
138
-
139
-
140
-
141
-
142
-
143
-
144
-
145
-
146
-
147
-
148
-
149
-
150
-
151
-
152
-
153
-
154
-
155
-
156
-
157
-
158
-
159
-
160
-
161
-
162
-
163
-
164
-
165
-
166
-
167
-
168
-
169
-
170
-
171
-
172
-
173
-
174
-
175
-
176
-
177
-
178
-
179
-
180
-
181
-
182
-
183
-
184
-
185
-
186
-
187
-
188
-
189
-
190
-
191
-
192
-
193
-
194
-
195
-
196
-
197
-
198
-
199
-
200
-
201
-
202
-
203
-
204
-
205
-
206
-
207
-
208
-
209
-
210
-
211
-
212
-
213
-
214
-
215
-
216
-
217
-
218
-
219
-
220
-
221
-
222
-
223
-
224
-
225
-
226
-
227
-
228
-
229
-
230
-
231
-
232
-
233
-
234
-
235
-
236
-
237
-
238
-
239
-
240
-
241
-
242
-
243
-
244
-
245
-
246
-
247
-
248
-
249
-
250
-
251
-
252
-
253
-
254
-
255
-
256
-
257
-
258
-
259
-
260
-
261
-
262
-
263
-
264
-
265
-
266
-
267
-
268
-
269
-
270
-
271
-
272
-
273
-
274
-
275
-
276
-
277
-
278
-
279
-
280
-
281
-
282
-
283
-
284
 |
 |

Bank of America 2012 81
and transfers to foreclosed properties more than offset new
origination volume retained on our balance sheet.
At December 31, 2012 and 2011, the residential mortgage
portfolio included $90.9 billion and $93.9 billion of outstanding
fully-insured loans. On this portion of the residential mortgage
portfolio, we are protected against principal loss as a result of
either FHA insurance or long-term stand-by agreements with FNMA
and FHLMC. At December 31, 2012 and 2011, $66.6 billion and
$69.5 billion had FHA insurance and $24.3 billion and $24.4 billion
were protected by long-term stand-by agreements. All of these
loans are individually insured and therefore the Corporation does
not record an allowance for credit losses with respect to these
loans.
At December 31, 2012 and 2011, $25.5 billion and $24.0
billion of the FHA-insured loan population were delinquent FHA
loans repurchased pursuant to our servicing agreements with
GNMA.
In addition to the long-term stand-by agreements with FNMA
and FHLMC, we have mitigated a portion of our credit risk on the
residential mortgage portfolio through the use of synthetic
securitization vehicles as described in Note 5 – Outstanding Loans
and Leases to the Consolidated Financial Statements. At
December 31, 2012 and 2011, the synthetic securitization
vehicles referenced principal balances of $17.6 billion and $23.9
billion of residential mortgage loans and provided loss protection
up to $500 million and $783 million. At December 31, 2012 and
2011, the Corporation had a receivable of $305 million and $359
million from these vehicles for reimbursement of losses. The
Corporation records an allowance for credit losses on loans
referenced by the synthetic securitization vehicles. The reported
net charge-offs for the residential mortgage portfolio do not include
the benefit of amounts reimbursable from these vehicles.
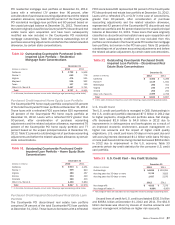
Adjusting for the benefit of the credit protection from the synthetic
securitizations, the residential mortgage net charge-off ratio,
excluding the Countrywide PCI and fully-insured loan portfolios, for
2012 would have been reduced by nine bps, and 13 bps for 2011.
Synthetic securitizations and the long-term stand-by
agreements with FNMA and FHLMC together reduce our regulatory
risk-weighted assets due to the transfer of a portion of our credit
risk to unaffiliated parties. At December 31, 2012 and 2011, these
programs had the cumulative effect of reducing our risk-weighted
assets by $7.2 billion and $7.9 billion, increasing our Tier 1 capital
ratio by eight bps for both periods, and our Tier 1 common capital
ratio by seven bps and six bps.
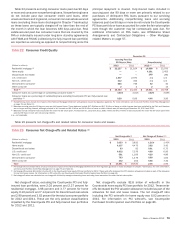
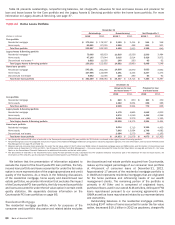
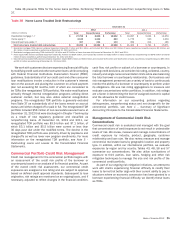
Table 25 presents certain residential mortgage key credit
statistics on both a reported basis excluding loans accounted for
under the fair value option, and excluding the Countrywide PCI loan
portfolio, fully-insured loan portfolio and loans accounted for under
the fair value option. We believe the presentation of information
adjusted to exclude these loan portfolios is more representative
of the credit risk in the residential mortgage loan portfolio. As
such, the following discussion presents the residential mortgage
portfolio excluding the Countrywide PCI loan portfolio, the fully-
insured loan portfolio and loans accounted for under the fair value
option. For more information on the Countrywide PCI loan portfolio,
see page 86.
Table 25 Residential Mortgage – Key Credit Statistics
December 31
Reported Basis (1)
Excluding Countrywide
Purchased Credit-impaired
and Fully-insured Loans
(Dollars in millions) 2012 2011 2012 2011
Outstandings $ 243,181 $ 262,290 $ 143,590 $ 158,470
Accruing past due 30 days or more 28,780 28,688 3,082 3,950
Accruing past due 90 days or more 22,157 21,164 n/a n/a
Nonperforming loans (2) 14,808 15,970 14,808 15,970
Percent of portfolio
Refreshed LTV greater than 90 but less than 100 16% 15% 10%11%
Refreshed LTV greater than 100 28 33 20 26
Refreshed FICO below 620 22 21 14 15
2006 and 2007 vintages (3) 24 27 34 37
Net charge-off ratio (2, 4) 1.21 1.45 2.02 2.27
(1) Outstandings, accruing past due, nonperforming loans and percentages of portfolio exclude loans accounted for under the fair value option. There were $147 million and $906 million of residential
mortgage loans accounted for under the fair value option at December 31, 2012 and 2011. See Consumer Portfolio Credit Risk Management – Consumer Loans Accounted for Under the Fair Value
Option on page 89 and Note 22 – Fair Value Option to the Consolidated Financial Statements for additional information on the fair value option.
(2) Nonperforming loans at December 31, 2012 and net charge-off ratios for 2012 include the impact of new regulatory guidance on loans discharged in Chapter 7 bankruptcy. For more information,
see Consumer Portfolio Credit Risk Management on page 76 and Table 21.
(3) These vintages of loans account for 60 percent and 63 percent of nonperforming residential mortgage loans at December 31, 2012 and 2011, and 72 percent and 73 percent of residential mortgage
net charge-offs in 2012 and 2011.
(4) Net charge-off ratios are calculated as net charge-offs divided by average outstanding loans excluding loans accounted for under the fair value option.
n/a = not applicable
Nonperforming residential mortgage loans decreased $1.2
billion in 2012 as paydowns, charge-offs and returns to performing
status, outpaced new inflows. In addition, nonperforming
residential mortgage loan balances at December 31, 2012
included $572 million due to new regulatory guidance related to
loans less than 60 days past due that were discharged in Chapter
7 bankruptcy. At December 31, 2012, borrowers were current on
contractual payments with respect to $3.5 billion, or 24 percent
of nonperforming residential mortgage loans, and $8.7 billion, or
59 percent of nonperforming residential mortgage loans were
180 days or more past due and had been written down to the
estimated fair value of the collateral less estimated costs to sell.
Accruing loans past due 30 days or more decreased $868 million
in 2012.
Net charge-offs decreased $779 million to $3.1 billion in 2012,
or 2.02 percent of total average residential mortgage loans,
compared to $3.8 billion, or 2.27 percent, for 2011. This decrease
in net charge-offs for 2012 was primarily driven by decreased write-