Bank of America 2012 Annual Report Download - page 70
Download and view the complete annual report
Please find page 70 of the 2012 Bank of America annual report below. You can navigate through the pages in the report by either clicking on the pages listed below, or by using the keyword search tool below to find specific information within the annual report.-
 1
1 -
2
-
3
-
4
-
5
-
6
-
7
-
8
-
9
-
10
-
11
-
12
-
13
-
14
-
15
-
16
-
17
-
18
-
19
-
20
-
21
-
22
-
23
-
24
-
25
-
26
-
27
-
28
-
29
-
30
-
31
-
32
-
33
-
34
-
35
-
36
-
37
-
38
-
39
-
40
-
41
-
42
-
43
-
44
-
45
-
46
-
47
-
48
-
49
-
50
-
51
-
52
-
53
-
54
-
55
-
56
-
57
-
58
-
59
-
 60
60 -
 61
61 -
 62
62 -
 63
63 -
 64
64 -
 65
65 -
 66
66 -
 67
67 -
 68
68 -
 69
69 -
 70
70 -
 71
71 -
 72
72 -
 73
73 -
 74
74 -
 75
75 -
 76
76 -
 77
77 -
 78
78 -
 79
79 -
 80
80 -
81
-
82
-
83
-
84
-
85
-
86
-
87
-
88
-
89
-
90
-
91
-
92
-
93
-
94
-
95
-
96
-
97
-
98
-
99
-
100
-
101
-
102
-
103
-
104
-
105
-
106
-
107
-
108
-
109
-
110
-
111
-
112
-
113
-
114
-
115
-
116
-
117
-
118
-
119
-
120
-
121
-
122
-
123
-
124
-
125
-
126
-
127
-
128
-
129
-
130
-
131
-
132
-
133
-
134
-
135
-
136
-
137
-
138
-
139
-
140
-
141
-
142
-
143
-
144
-
145
-
146
-
147
-
148
-
149
-
150
-
151
-
152
-
153
-
154
-
155
-
156
-
157
-
158
-
159
-
160
-
161
-
162
-
163
-
164
-
165
-
166
-
167
-
168
-
169
-
170
-
171
-
172
-
173
-
174
-
175
-
176
-
177
-
178
-
179
-
180
-
181
-
182
-
183
-
184
-
185
-
186
-
187
-
188
-
189
-
190
-
191
-
192
-
193
-
194
-
195
-
196
-
197
-
198
-
199
-
200
-
201
-
202
-
203
-
204
-
205
-
206
-
207
-
208
-
209
-
210
-
211
-
212
-
213
-
214
-
215
-
216
-
217
-
218
-
219
-
220
-
221
-
222
-
223
-
224
-
225
-
226
-
227
-
228
-
229
-
230
-
231
-
232
-
233
-
234
-
235
-
236
-
237
-
238
-
239
-
240
-
241
-
242
-
243
-
244
-
245
-
246
-
247
-
248
-
249
-
250
-
251
-
252
-
253
-
254
-
255
-
256
-
257
-
258
-
259
-
260
-
261
-
262
-
263
-
264
-
265
-
266
-
267
-
268
-
269
-
270
-
271
-
272
-
273
-
274
-
275
-
276
-
277
-
278
-
279
-
280
-
281
-
282
-
283
-
284
 |
 |

68 Bank of America 2012
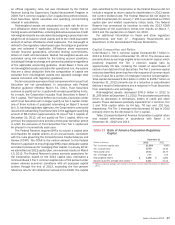
Table 14 presents the capital composition at December 31, 2012 and 2011.
Table 14 Capital Composition
December 31
(Dollars in millions) 2012 2011
Total common shareholders’ equity $ 218,188 $ 211,704
Goodwill (69,976) (69,967)
Nonqualifying intangible assets (includes core deposit intangibles, affinity relationships, customer relationships and other intangibles) (4,994)(5,848)
Net unrealized gains on AFS debt and marketable equity securities and net losses on derivatives recorded in accumulated OCI,
net-of-tax (2,036)682
Unamortized net periodic benefit costs recorded in accumulated OCI, net-of-tax 4,456 4,391
Fair value adjustment related to structured liabilities (1) 4,084 944
Disallowed deferred tax asset (17,940) (16,799)
Other 1,621 1,583
Total Tier 1 common capital 133,403 126,690
Qualifying preferred stock 15,851 15,479
Trust preferred securities 6,207 16,737
Noncontrolling interests —326
Total Tier 1 capital 155,461 159,232
Long-term debt qualifying as Tier 2 capital 24,287 38,165
Allowance for loan and lease losses 24,179 33,783
Reserve for unfunded lending commitments 513 714
Allowance for loan and lease losses exceeding 1.25 percent of risk-weighted assets (9,459)(18,159)
45 percent of the pre-tax net unrealized gains on AFS marketable equity securities 329 1
Other 1,370 1,365
Total capital $ 196,680 $ 215,101
(1) Represents loss on structured liabilities, net-of-tax, that is excluded from Tier 1 common capital, Tier 1 capital and Total capital for regulatory capital purposes.
Regulatory Capital Changes
At December 31, 2012, we measured and reported our capital
ratios and related information in accordance with Basel 1. We
manage regulatory capital to adhere to internal capital guidelines
and regulatory standards of capital adequacy based on our current
understanding of the rules and the application of such rules to
our business as currently conducted. See Capital Management on
page 66 for additional information.
In June 2012, U.S. banking regulators issued the Market Risk
Final Rule that amends the Basel 1 Market Risk rules (Market Risk
Final Rule) effective January 1, 2013. The Market Risk Final Rule
introduces new measures of market risk, a charge related to a
stressed Value-at-Risk (VaR), an incremental risk charge and a
comprehensive risk measure, as well as other technical
modifications. As of December 31, 2012, the estimated impact
of the Market Risk Final Rule would have been a 68 bps decrease
in the Tier 1 common capital ratio to 10.38 percent as a result of
a $78.8 billion increase in risk-weighted assets for market risk
exposures.
The regulatory capital rules continue to expand and evolve. In
December 2007, U.S. banking regulators published final Basel 2
rules (Basel 2). We measure and report our capital ratios and
related information under Basel 2 on a confidential basis to U.S.
banking regulators during the required parallel period, during which
we provide the U.S. banking regulators both Basel 1 and Basel 2
related information in parallel. The parallel period will continue
until we receive regulatory approval to exit parallel reporting and
subsequently begin publicly reporting our Basel 2 regulatory
capital results and related disclosures.
In June 2012, U.S. banking regulators issued three notices of
proposed rulemaking (collectively, the Basel 3 NPRs) which, if
adopted as proposed, would materially change Tier 1 common,
Tier 1 and Total capital calculations. The Basel 3 NPRs also
introduce new minimum capital ratios and buffer requirements,
expand and modify the calculation of risk-weighted assets for credit
and market risk (the Advanced Approach) and introduce a
Standardized Approach for the calculation of risk-weighted assets,
which would replace Basel 1 and provide a floor for minimum,
adequately capitalized regulatory capital requirements under the
Prompt Corrective Action framework. The Prompt Corrective Action
framework establishes categories of capitalization, including “well-
capitalized,” based on regulatory ratio requirements. U.S. banking
regulators are required to take certain mandatory actions
depending on the category of capitalization. No mandatory actions
are required under the Prompt Corrective Action framework for
“well-capitalized” banking entities.
Under the Basel 3 NPRs, Trust Securities will be phased out
of Tier 1 capital in equal annual installments over a three-year
transition period. Many of the changes to the composition of
regulatory capital are subject to a transition period where the
impact is recognized in 20 percent increments, phased in
incrementally each year over a five-year period. The phase-in period
for the new minimum capital requirements and related buffers is
proposed to occur from the effective date of the Basel 3 NPRs
through 2019. On November 9, 2012, U.S. banking regulators
announced that they did not expect any of the Basel 3 NPRs to
become effective January 1, 2013. Final rules for Basel 3 have
not yet been issued by U.S. banking regulators.
Under the Basel 3 NPRs we will be subject to the Advanced
Approach for measuring risk-weighted assets (Basel 3 Advanced
Approach) when finalized and implemented. The Basel 3 Advanced
Approach also requires approval by the U.S. regulatory agencies
of analytical models used as part of capital measurement. If these
models are not approved, it would likely lead to an increase in our
risk-weighted assets, which in some cases could be significant.
The Basel 3 Advanced Approach, if adopted as proposed, is
expected to substantially increase our capital requirements as
discussed below.