Bank of America 2012 Annual Report Download - page 101
Download and view the complete annual report
Please find page 101 of the 2012 Bank of America annual report below. You can navigate through the pages in the report by either clicking on the pages listed below, or by using the keyword search tool below to find specific information within the annual report.-
 1
1 -
2
-
3
-
4
-
5
-
6
-
7
-
8
-
9
-
10
-
11
-
12
-
13
-
14
-
15
-
16
-
17
-
18
-
19
-
20
-
21
-
22
-
23
-
24
-
25
-
26
-
27
-
28
-
29
-
30
-
31
-
32
-
33
-
34
-
35
-
36
-
37
-
38
-
39
-
40
-
41
-
42
-
43
-
44
-
45
-
46
-
47
-
48
-
49
-
50
-
51
-
52
-
53
-
54
-
55
-
56
-
57
-
58
-
59
-
60
-
61
-
62
-
63
-
64
-
65
-
66
-
67
-
68
-
69
-
70
-
71
-
72
-
73
-
74
-
75
-
76
-
77
-
78
-
79
-
80
-
81
-
82
-
83
-
84
-
85
-
86
-
87
-
88
-
89
-
90
-
 91
91 -
 92
92 -
 93
93 -
 94
94 -
 95
95 -
 96
96 -
 97
97 -
 98
98 -
 99
99 -
 100
100 -
 101
101 -
 102
102 -
 103
103 -
 104
104 -
 105
105 -
 106
106 -
 107
107 -
 108
108 -
 109
109 -
 110
110 -
 111
111 -
112
-
113
-
114
-
115
-
116
-
117
-
118
-
119
-
120
-
121
-
122
-
123
-
124
-
125
-
126
-
127
-
128
-
129
-
130
-
131
-
132
-
133
-
134
-
135
-
136
-
137
-
138
-
139
-
140
-
141
-
142
-
143
-
144
-
145
-
146
-
147
-
148
-
149
-
150
-
151
-
152
-
153
-
154
-
155
-
156
-
157
-
158
-
159
-
160
-
161
-
162
-
163
-
164
-
165
-
166
-
167
-
168
-
169
-
170
-
171
-
172
-
173
-
174
-
175
-
176
-
177
-
178
-
179
-
180
-
181
-
182
-
183
-
184
-
185
-
186
-
187
-
188
-
189
-
190
-
191
-
192
-
193
-
194
-
195
-
196
-
197
-
198
-
199
-
200
-
201
-
202
-
203
-
204
-
205
-
206
-
207
-
208
-
209
-
210
-
211
-
212
-
213
-
214
-
215
-
216
-
217
-
218
-
219
-
220
-
221
-
222
-
223
-
224
-
225
-
226
-
227
-
228
-
229
-
230
-
231
-
232
-
233
-
234
-
235
-
236
-
237
-
238
-
239
-
240
-
241
-
242
-
243
-
244
-
245
-
246
-
247
-
248
-
249
-
250
-
251
-
252
-
253
-
254
-
255
-
256
-
257
-
258
-
259
-
260
-
261
-
262
-
263
-
264
-
265
-
266
-
267
-
268
-
269
-
270
-
271
-
272
-
273
-
274
-
275
-
276
-
277
-
278
-
279
-
280
-
281
-
282
-
283
-
284
 |
 |

Bank of America 2012 99
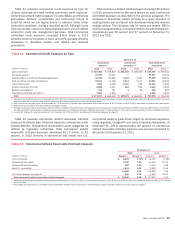
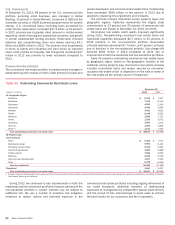
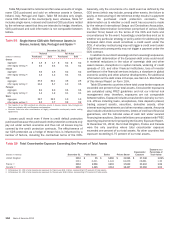
Table 48 Commercial Credit Exposure by Industry (1)
December 31
Commercial
Utilized
Total Commercial
Committed
(Dollars in millions) 2012 2011 2012 2011
Diversified financials $ 66,201 $ 64,957 $99,673 $ 94,969
Real estate (2) 47,479 48,138 65,639 62,566
Government and public education 41,449 43,090 50,285 57,021
Capital goods 25,071 24,025 49,196 48,013
Retailing 28,065 25,478 47,719 46,290
Healthcare equipment and services 29,396 31,298 45,488 48,141
Banking 40,245 35,231 45,238 38,735
Materials 21,809 19,384 40,493 38,070
Energy 17,684 15,151 38,464 32,074
Food, beverage and tobacco 14,738 15,904 37,344 30,501
Consumer services 23,093 24,445 36,367 38,498
Commercial services and supplies 19,020 20,089 30,257 30,831
Utilities 8,410 8,102 23,432 24,552
Media 13,091 11,447 21,705 21,158
Transportation 13,791 12,683 20,255 19,036
Individuals and trusts 13,916 14,993 17,801 19,001
Insurance, including monolines 8,519 10,090 14,145 16,157
Software and services 5,549 4,304 12,125 9,579
Pharmaceuticals and biotechnology 3,854 4,141 11,409 11,328
Technology hardware and equipment 5,118 5,247 11,108 12,173
Telecommunication services 4,029 4,297 10,297 10,424
Religious and social organizations 6,850 8,536 9,107 11,160
Consumer durables and apparel 4,246 4,505 8,438 8,965
Automobiles and components 3,312 2,813 7,675 7,178
Food and staples retailing 3,528 3,273 6,838 6,476
Other 3,264 4,888 6,507 7,636
Total commercial credit exposure by industry $ 471,727 $466,509 $ 767,005 $ 750,532
Net credit default protection purchased on total commitments (3) $ (14,657) $ (19,356)
(1) Includes U.S. small business commercial exposure.
(2) Industries are viewed from a variety of perspectives to best isolate the perceived risks. For purposes of this table, the real estate industry is defined based on the borrowers’ or counterparties’
primary business activity using operating cash flows and primary source of repayment as key factors.
(3) Represents net notional credit protection purchased. See Risk Mitigation on page 100 for additional information.
Monoline Exposure
Monoline exposure is reported in the insurance industry and
managed under insurance portfolio industry limits. We have
indirect exposure to monolines primarily in the form of guarantees
supporting our loans, investment portfolios, securitizations and
credit-enhanced securities as part of our public finance business
and other selected products. Such indirect exposure exists when
we purchase credit protection from monolines to hedge all or a
portion of the credit risk on certain credit exposures including
loans and CDOs. We underwrite our public finance exposure by
evaluating the underlying securities.
We also have indirect exposure to monolines in the form of
guarantees supporting our mortgage and other loan sales. Indirect
exposure may exist when credit protection was purchased from
monolines to hedge all or a portion of the credit risk on certain
mortgage and other loan exposures. A loss may occur when we
are required to repurchase a loan and the market value of the loan
has declined, or we are required to indemnify or provide recourse
for a guarantor’s loss. For additional information regarding our
exposure to representations and warranties, see Off-Balance
Sheet Arrangements and Contractual Obligations –
Representations and Warranties on page 50 and Note 8 –
Representations and Warranties Obligations and Corporate
Guarantees to the Consolidated Financial Statements.
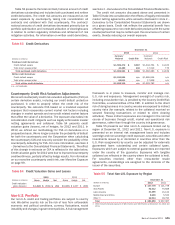
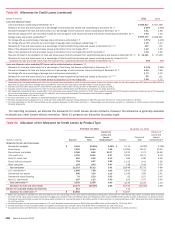
Table 49 presents the notional amount of our monoline
derivative credit exposure, mark-to-market adjustment and the
counterparty credit valuation adjustment.
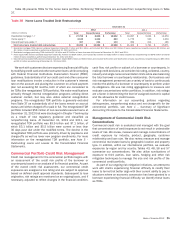
Table 49 Derivative Credit Exposures
December 31
(Dollars in millions) 2012 2011
Notional amount of monoline exposure $ 13,547 $ 21,070
Mark-to-market $ 898 $ 1,766
Counterparty credit valuation adjustment (118) (417)
Net mark-to-market $ 780 $ 1,349
2012 2011
Gains (losses) from credit valuation changes $ 213 $ (1,000)
The notional amount of monoline exposure at December 31,
2012 decreased $7.5 billion from December 31, 2011 due to
terminations, paydowns and maturities of monoline contracts. In
addition, $1.3 billion of monoline exposure with a single
counterparty ($4.9 billion gross receivable less impairment) was
included in other assets at December 31, 2012 and 2011. The
contracts are no longer considered to be derivative trading
instruments because of the inherent default risk and they no longer