Bank of America 2012 Annual Report Download - page 159
Download and view the complete annual report
Please find page 159 of the 2012 Bank of America annual report below. You can navigate through the pages in the report by either clicking on the pages listed below, or by using the keyword search tool below to find specific information within the annual report.-
 1
1 -
2
-
3
-
4
-
5
-
6
-
7
-
8
-
9
-
10
-
11
-
12
-
13
-
14
-
15
-
16
-
17
-
18
-
19
-
20
-
21
-
22
-
23
-
24
-
25
-
26
-
27
-
28
-
29
-
30
-
31
-
32
-
33
-
34
-
35
-
36
-
37
-
38
-
39
-
40
-
41
-
42
-
43
-
44
-
45
-
46
-
47
-
48
-
49
-
50
-
51
-
52
-
53
-
54
-
55
-
56
-
57
-
58
-
59
-
60
-
61
-
62
-
63
-
64
-
65
-
66
-
67
-
68
-
69
-
70
-
71
-
72
-
73
-
74
-
75
-
76
-
77
-
78
-
79
-
80
-
81
-
82
-
83
-
84
-
85
-
86
-
87
-
88
-
89
-
90
-
91
-
92
-
93
-
94
-
95
-
96
-
97
-
98
-
99
-
100
-
101
-
102
-
103
-
104
-
105
-
106
-
107
-
108
-
109
-
110
-
111
-
112
-
113
-
114
-
115
-
116
-
117
-
118
-
119
-
120
-
121
-
122
-
123
-
124
-
125
-
126
-
127
-
128
-
129
-
130
-
131
-
132
-
133
-
134
-
135
-
136
-
137
-
138
-
139
-
140
-
141
-
142
-
143
-
144
-
145
-
146
-
147
-
148
-
 149
149 -
 150
150 -
 151
151 -
 152
152 -
 153
153 -
 154
154 -
 155
155 -
 156
156 -
 157
157 -
 158
158 -
 159
159 -
 160
160 -
 161
161 -
 162
162 -
 163
163 -
 164
164 -
 165
165 -
 166
166 -
 167
167 -
 168
168 -
 169
169 -
170
-
171
-
172
-
173
-
174
-
175
-
176
-
177
-
178
-
179
-
180
-
181
-
182
-
183
-
184
-
185
-
186
-
187
-
188
-
189
-
190
-
191
-
192
-
193
-
194
-
195
-
196
-
197
-
198
-
199
-
200
-
201
-
202
-
203
-
204
-
205
-
206
-
207
-
208
-
209
-
210
-
211
-
212
-
213
-
214
-
215
-
216
-
217
-
218
-
219
-
220
-
221
-
222
-
223
-
224
-
225
-
226
-
227
-
228
-
229
-
230
-
231
-
232
-
233
-
234
-
235
-
236
-
237
-
238
-
239
-
240
-
241
-
242
-
243
-
244
-
245
-
246
-
247
-
248
-
249
-
250
-
251
-
252
-
253
-
254
-
255
-
256
-
257
-
258
-
259
-
260
-
261
-
262
-
263
-
264
-
265
-
266
-
267
-
268
-
269
-
270
-
271
-
272
-
273
-
274
-
275
-
276
-
277
-
278
-
279
-
280
-
281
-
282
-
283
-
284
 |
 |

Bank of America 2012 157
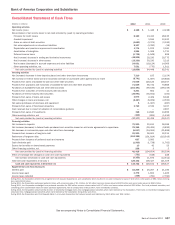
Bank of America Corporation and Subsidiaries
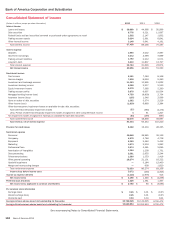
Consolidated Statement of Cash Flows
(Dollars in millions) 2012 2011 2010
Operating activities
Net income (loss) $ 4,188 $ 1,446 $ (2,238)
Reconciliation of net income (loss) to net cash provided by (used in) operating activities:
Provision for credit losses 8,169 13,410 28,435
Goodwill impairment —3,184 12,400
Gains on sales of debt securities (1,662)(3,374) (2,526)
Fair value adjustments on structured liabilities 5,107 (3,320) (18)
Depreciation and premises improvements amortization 1,774 1,976 2,181
Amortization of intangibles 1,264 1,509 1,731
Deferred income taxes (2,735)(1,949) 608
Net (increase) decrease in trading and derivative instruments (48,225) 20,230 20,775
Net (increase) decrease in other assets (13,330) 50,230 5,213
Net increase (decrease) in accrued expenses and other liabilities 24,061 (18,124) 14,069
Other operating activities, net 7,531 (770) 1,911
Net cash provided by (used in) operating activities (13,858) 64,448 82,541
Investing activities
Net (increase) decrease in time deposits placed and other short-term investments 7,310 105 (2,154)
Net increase in federal funds sold and securities borrowed or purchased under agreements to resell (8,741)(1,567) (19,683)
Proceeds from sales of available-for-sale and other debt securities 74,068 120,125 100,047
Proceeds from paydowns and maturities of available-for-sale and other debt securities 71,509 56,732 70,868
Purchases of available-for-sale and other debt securities (164,491) (99,536) (199,159)
Proceeds from maturities of held-to-maturity debt securities 6,261 602 11
Purchases of held-to-maturity debt securities (20,991) (35,552) (100)
Proceeds from sales of loans and leases 1,673 2,409 8,046
Other changes in loans and leases, net (6,457)(6,059) (2,550)
Net sales (purchases) of premises and equipment 5(1,307) (987)
Proceeds from sales of foreclosed properties 2,799 2,532 3,107
Cash received due to impact of adoption of consolidation guidance —— 2,807
Proceeds from sales of investments 198 14,840 10,856
Other investing activities, net (320) (895) (1,456)
Net cash provided by (used in) investing activities (37,177) 52,429 (30,347)
Financing activities
Net increase in deposits 72,220 22,611 36,598
Net increase (decrease) in federal funds purchased and securities loaned or sold under agreements to repurchase 78,395 (30,495) (9,826)
Net decrease in commercial paper and other short-term borrowings (5,017)(24,264) (31,698)
Proceeds from issuance of long-term debt 22,200 26,001 52,215
Retirement of long-term debt (124,389) (101,814) (110,919)
Proceeds from issuance of preferred stock and warrants 667 5,000 —
Cash dividends paid (1,909)(1,738) (1,762)
Excess tax benefits on share-based payments 13 42 53
Other financing activities, net 236 35
Net cash provided by (used in) financing activities 42,416 (104,654) (65,334)
Effect of exchange rate changes on cash and cash equivalents (731) (548) 228
Net increase (decrease) in cash and cash equivalents (9,350)11,675 (12,912)
Cash and cash equivalents at January 1 120,102 108,427 121,339
Cash and cash equivalents at December 31 $ 110,752 $120,102 $ 108,427
Supplemental cash flow disclosures
Interest paid $ 18,268 $ 25,207 $ 21,166
Income taxes paid 1,372 1,653 1,465
Income taxes refunded (338) (781) (7,783)
During 2011, the Corporation entered into an agreement with Assured Guaranty Ltd. and subsidiaries which resulted in non-cash increases to loans of $2.2 billion, other assets of $82 million and long-
term debt of $2.3 billion.
During 2011, the Corporation exchanged preferred stock, with a carrying value of $1.1 billion, for 92 million common shares valued at $522 million and senior notes valued at $360 million.
During 2011, the Corporation exchanged trust preferred securities for 308 million common shares valued at $1.7 billion and senior notes valued at $2.0 billion. The trust preferred securities, and
underlying junior subordinated notes and stock purchase agreements, with a carrying value of $5.2 billion, were immediately canceled.
During 2010, the Corporation securitized $2.4 billion of residential mortgage loans into mortgage-backed securities which were retained by the Corporation. There were no residential mortgage loans
securitized into mortgage-backed securities which were retained by the Corporation during 2012 and 2011.
During 2010, the Corporation sold First Republic Bank in a non-cash transaction that reduced assets and liabilities by $19.5 billion and $18.1 billion.
See accompanying Notes to Consolidated Financial Statements.