Bank of America 2012 Annual Report Download - page 96
Download and view the complete annual report
Please find page 96 of the 2012 Bank of America annual report below. You can navigate through the pages in the report by either clicking on the pages listed below, or by using the keyword search tool below to find specific information within the annual report.-
 1
1 -
2
-
3
-
4
-
5
-
6
-
7
-
8
-
9
-
10
-
11
-
12
-
13
-
14
-
15
-
16
-
17
-
18
-
19
-
20
-
21
-
22
-
23
-
24
-
25
-
26
-
27
-
28
-
29
-
30
-
31
-
32
-
33
-
34
-
35
-
36
-
37
-
38
-
39
-
40
-
41
-
42
-
43
-
44
-
45
-
46
-
47
-
48
-
49
-
50
-
51
-
52
-
53
-
54
-
55
-
56
-
57
-
58
-
59
-
60
-
61
-
62
-
63
-
64
-
65
-
66
-
67
-
68
-
69
-
70
-
71
-
72
-
73
-
74
-
75
-
76
-
77
-
78
-
79
-
80
-
81
-
82
-
83
-
84
-
85
-
 86
86 -
 87
87 -
 88
88 -
 89
89 -
 90
90 -
 91
91 -
 92
92 -
 93
93 -
 94
94 -
 95
95 -
 96
96 -
 97
97 -
 98
98 -
 99
99 -
 100
100 -
 101
101 -
 102
102 -
 103
103 -
 104
104 -
 105
105 -
 106
106 -
107
-
108
-
109
-
110
-
111
-
112
-
113
-
114
-
115
-
116
-
117
-
118
-
119
-
120
-
121
-
122
-
123
-
124
-
125
-
126
-
127
-
128
-
129
-
130
-
131
-
132
-
133
-
134
-
135
-
136
-
137
-
138
-
139
-
140
-
141
-
142
-
143
-
144
-
145
-
146
-
147
-
148
-
149
-
150
-
151
-
152
-
153
-
154
-
155
-
156
-
157
-
158
-
159
-
160
-
161
-
162
-
163
-
164
-
165
-
166
-
167
-
168
-
169
-
170
-
171
-
172
-
173
-
174
-
175
-
176
-
177
-
178
-
179
-
180
-
181
-
182
-
183
-
184
-
185
-
186
-
187
-
188
-
189
-
190
-
191
-
192
-
193
-
194
-
195
-
196
-
197
-
198
-
199
-
200
-
201
-
202
-
203
-
204
-
205
-
206
-
207
-
208
-
209
-
210
-
211
-
212
-
213
-
214
-
215
-
216
-
217
-
218
-
219
-
220
-
221
-
222
-
223
-
224
-
225
-
226
-
227
-
228
-
229
-
230
-
231
-
232
-
233
-
234
-
235
-
236
-
237
-
238
-
239
-
240
-
241
-
242
-
243
-
244
-
245
-
246
-
247
-
248
-
249
-
250
-
251
-
252
-
253
-
254
-
255
-
256
-
257
-
258
-
259
-
260
-
261
-
262
-
263
-
264
-
265
-
266
-
267
-
268
-
269
-
270
-
271
-
272
-
273
-
274
-
275
-
276
-
277
-
278
-
279
-
280
-
281
-
282
-
283
-
284
 |
 |

94 Bank of America 2012
U.S. Commercial
At December 31, 2012, 68 percent of the U.S. commercial loan
portfolio, excluding small business, was managed in Global
Banking, 10 percent in Global Markets, 10 percent in CBB and the
remainder primarily in GWIM (business-purpose loans for wealthy
clients). U.S. commercial loans, excluding loans accounted for
under the fair value option, increased $17.2 billion, or 10 percent,
in 2012 primarily due to greater client demand in middle-market
segments, dealer financing and specialized industries, and growth
in certain asset-backed lending products. Reservable criticized
balances and nonperforming loans and leases declined $3.1
billion and $690 million in 2012. The declines were broad-based
in terms of clients and industries and were driven by improved
client credit profiles and liquidity. Net charge-offs increased $47
million in 2012 due primarily to lower recoveries compared to
2011.
Commercial Real Estate
The commercial real estate portfolio is predominantly managed in
Global Banking and consists of loans made primarily to public and
private developers, and commercial real estate firms. Outstanding
loans decreased $959 million, or two percent, in 2012 due to
paydowns outpacing new originations and renewals.
The portfolio remains diversified across property types and
geographic regions. California represented the largest state
concentration at 23 percent and 20 percent of commercial real
estate loans and leases at December 31, 2012 and 2011.
Commercial real estate credit quality improved significantly
during 2012. Nonperforming commercial real estate loans and
foreclosed properties decreased $2.7 billion, or 61 percent, in
2012 primarily in the non-residential portfolio. Reservable
criticized balances decreased $7.7 billion, or 67 percent, primarily
due to declines in the non-residential portfolio. Net charge-offs
declined $563 million in 2012 compared to 2011 due to
improvement in both the residential and non-residential portfolios.
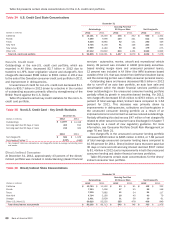
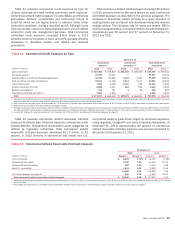
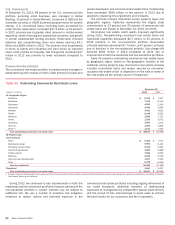
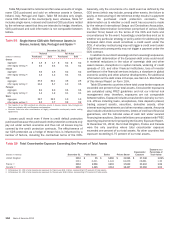
Table 43 presents outstanding commercial real estate loans
by geographic region, based on the geographic location of the
collateral, and by property type. Commercial real estate primarily
includes commercial loans and leases secured by non-owner-
occupied real estate which is dependent on the sale or lease of
the real estate as the primary source of repayment.
Table 43 Outstanding Commercial Real Estate Loans
December 31
(Dollars in millions) 2012 2011
By Geographic Region
California $ 8,792 $ 7,957
Northeast 7,315 6,554
Southwest 4,612 5,243
Southeast 4,440 4,844
Midwest 3,421 4,051
Florida 2,148 2,502
Midsouth 1,980 1,751
Illinois 1,700 1,871
Northwest 1,553 1,574
Non-U.S. 1,483 1,824
Other (1) 1,193 1,425
Total outstanding commercial real estate loans $ 38,637 $ 39,596
By Property Type
Non-residential
Office $ 9,324 $ 7,571
Multi-family rental 5,893 6,105
Shopping centers/retail 5,780 5,985
Industrial/warehouse 3,839 3,988
Hotels/motels 3,095 2,653
Multi-use 2,186 3,218
Land and land development 1,157 1,599
Other 5,722 6,050
Total non-residential 36,996 37,169
Residential 1,641 2,427
Total outstanding commercial real estate loans $ 38,637 $ 39,596
(1) Includes unsecured outstandings to real estate investment trusts and national home builders whose portfolios of properties span multiple geographic regions and properties in the states of Colorado,
Utah, Hawaii, Wyoming and Montana.
During 2012, we continued to see improvements in both the
residential and non-residential portfolios; however, portions of the
non-residential portfolio in certain markets may be subject to
additional risk. We use a number of proactive risk mitigation
initiatives to reduce utilized and potential exposure in the
commercial real estate portfolios including ongoing refinement of
our credit standards, additional transfers of deteriorating
exposures to management by independent special asset officers
and the pursuit of loan restructurings or asset sales to achieve
the best results for our customers and the Corporation.