Bank of America 2012 Annual Report Download - page 203
Download and view the complete annual report
Please find page 203 of the 2012 Bank of America annual report below. You can navigate through the pages in the report by either clicking on the pages listed below, or by using the keyword search tool below to find specific information within the annual report.-
 1
1 -
2
-
3
-
4
-
5
-
6
-
7
-
8
-
9
-
10
-
11
-
12
-
13
-
14
-
15
-
16
-
17
-
18
-
19
-
20
-
21
-
22
-
23
-
24
-
25
-
26
-
27
-
28
-
29
-
30
-
31
-
32
-
33
-
34
-
35
-
36
-
37
-
38
-
39
-
40
-
41
-
42
-
43
-
44
-
45
-
46
-
47
-
48
-
49
-
50
-
51
-
52
-
53
-
54
-
55
-
56
-
57
-
58
-
59
-
60
-
61
-
62
-
63
-
64
-
65
-
66
-
67
-
68
-
69
-
70
-
71
-
72
-
73
-
74
-
75
-
76
-
77
-
78
-
79
-
80
-
81
-
82
-
83
-
84
-
85
-
86
-
87
-
88
-
89
-
90
-
91
-
92
-
93
-
94
-
95
-
96
-
97
-
98
-
99
-
100
-
101
-
102
-
103
-
104
-
105
-
106
-
107
-
108
-
109
-
110
-
111
-
112
-
113
-
114
-
115
-
116
-
117
-
118
-
119
-
120
-
121
-
122
-
123
-
124
-
125
-
126
-
127
-
128
-
129
-
130
-
131
-
132
-
133
-
134
-
135
-
136
-
137
-
138
-
139
-
140
-
141
-
142
-
143
-
144
-
145
-
146
-
147
-
148
-
149
-
150
-
151
-
152
-
153
-
154
-
155
-
156
-
157
-
158
-
159
-
160
-
161
-
162
-
163
-
164
-
165
-
166
-
167
-
168
-
169
-
170
-
171
-
172
-
173
-
174
-
175
-
176
-
177
-
178
-
179
-
180
-
181
-
182
-
183
-
184
-
185
-
186
-
187
-
188
-
189
-
190
-
191
-
192
-
 193
193 -
 194
194 -
 195
195 -
 196
196 -
 197
197 -
 198
198 -
 199
199 -
 200
200 -
 201
201 -
 202
202 -
 203
203 -
 204
204 -
 205
205 -
 206
206 -
 207
207 -
 208
208 -
 209
209 -
 210
210 -
 211
211 -
 212
212 -
 213
213 -
214
-
215
-
216
-
217
-
218
-
219
-
220
-
221
-
222
-
223
-
224
-
225
-
226
-
227
-
228
-
229
-
230
-
231
-
232
-
233
-
234
-
235
-
236
-
237
-
238
-
239
-
240
-
241
-
242
-
243
-
244
-
245
-
246
-
247
-
248
-
249
-
250
-
251
-
252
-
253
-
254
-
255
-
256
-
257
-
258
-
259
-
260
-
261
-
262
-
263
-
264
-
265
-
266
-
267
-
268
-
269
-
270
-
271
-
272
-
273
-
274
-
275
-
276
-
277
-
278
-
279
-
280
-
281
-
282
-
283
-
284
 |
 |

Bank of America 2012 201
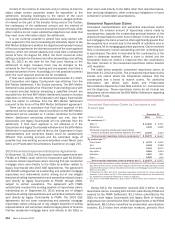
securities. In addition, the Corporation has retained commercial
MSRs from the sale or securitization of commercial mortgage
loans. Servicing advances on commercial mortgage loans,
including securitizations where the Corporation has continuing
involvement, were $186 million and $152 million at December 31,
2012 and 2011. For additional information on MSRs, see Note 24
– Mortgage Servicing Rights.
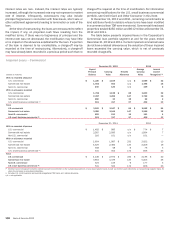
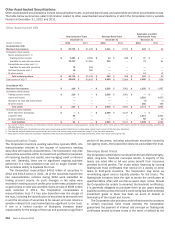
The table below summarizes select information related to first-
lien mortgage securitization trusts in which the Corporation held
a variable interest at December 31, 2012 and 2011.
First-lien VIEs
Residential Mortgage
Non-agency
Agency Prime Subprime Alt-A
Commercial
Mortgage
December 31 December 31 December 31
(Dollars in millions) 2012 2011 2012 2011 2012 2011 2012 2011 2012 2011
Unconsolidated VIEs
Maximum loss exposure (1) $ 28,591 $ 37,519 $ 2,038 $ 2,375 $410 $ 289 $367 $ 506 $702 $ 981
On-balance sheet assets
Senior securities held (2):
Trading account assets $ 619 $ 8,744 $ 16 $ 94 $ 14 $3
$—
$ 343 $12 $ 21
Available-for-sale debt securities 25,492 28,775 1,388 2,001 210 174 128 163 581 846
Subordinate securities held (2):
Trading account assets ————330 ——13 3
Available-for-sale debt securities ——21 26 930 ————
Residual interests held ——18 899——40 43
All other assets (3) 2,480 —64 —1—239 ———
Total retained positions $ 28,591 $ 37,519 $ 1,507 $ 2,129 $246 $ 246 $367 $ 506 $646 $ 913
Principal balance outstanding (4) $ 797,315 $ 1,198,766 $ 45,819 $ 61,207 $ 53,822 $ 73,949 $ 71,990 $101,622 $56,733 $ 76,645
Consolidated VIEs
Maximum loss exposure (1) $ 46,959 $ 50,648 $ 104 $ 450 $390 $ 419 $—
$—
$—$—
On-balance sheet assets
Loans and leases $ 45,991 $ 50,159 $ 283 $ 1,298 $722 $ 892 $—
$—
$—$—
Allowance for loan and lease losses (4) (6) ————————
Loans held-for-sale ————914 622 ————
All other assets 972 495 10 63 91 59 ————
Total assets $ 46,959 $ 50,648 $ 293 $ 1,361 $ 1,727 $ 1,573 $—
$—
$—$—
On-balance sheet liabilities
Other short-term borrowings $—
$—
$—
$—
$741 $ 650 $—
$—
$—$—
Long-term debt ——212 1,360 941 911 ————
All other liabilities —————57 ————
Total liabilities $—
$—
$ 212 $ 1,360 $ 1,682 $ 1,618 $—
$—
$—$—
(1) Maximum loss exposure excludes the liability for representations and warranties obligations and corporate guarantees and also excludes servicing advances and MSRs. For more information, see
Note 8 – Representations and Warranties Obligations and Corporate Guarantees and Note 24 – Mortgage Servicing Rights.
(2) As a holder of these securities, the Corporation receives scheduled principal and interest payments. During 2012 and 2011, there were no OTTI losses recorded on those securities classified as
AFS debt securities.
(3) Not included in the table above are all other assets of $12.1 billion and $11.0 billion, representing the unpaid principal balance of mortgage loans eligible for repurchase from unconsolidated
residential mortgage securitization vehicles, principally guaranteed by GNMA, and all other liabilities of $12.1 billion and $11.0 billion, representing the principal amount that would be payable to the
securitization vehicles if the Corporation were to exercise the repurchase option, at December 31, 2012 and 2011.
(4) Principal balance outstanding includes loans the Corporation transferred with which the Corporation has continuing involvement, which may include servicing the loans.
During 2012, the Corporation deconsolidated several prime
residential mortgage trusts with total assets of $1.2 billion
following the transfer of servicing to a third party.
As a result of a settlement agreement with Assured Guaranty
Ltd. and its subsidiaries (Assured Guaranty) in 2011, the
Corporation entered into a loss-sharing reinsurance arrangement
involving 21 first-lien RMBS trusts. This obligation is a variable
interest that could potentially be significant to the trusts. To the
extent that the Corporation services all or a majority of the loans
in any of the 21 trusts, the Corporation is the primary beneficiary.
At December 31, 2012, four of these trusts with total assets of
$900 million were consolidated. Assets and liabilities of the
consolidated trusts and the Corporation’s maximum loss exposure
to consolidated and unconsolidated trusts are included in the table
above as non-agency prime and subprime trusts. For additional
information, see Note 8 – Representations and Warranties
Obligations and Corporate Guarantees.