Bank of America 2012 Annual Report Download - page 204
Download and view the complete annual report
Please find page 204 of the 2012 Bank of America annual report below. You can navigate through the pages in the report by either clicking on the pages listed below, or by using the keyword search tool below to find specific information within the annual report.-
 1
1 -
2
-
3
-
4
-
5
-
6
-
7
-
8
-
9
-
10
-
11
-
12
-
13
-
14
-
15
-
16
-
17
-
18
-
19
-
20
-
21
-
22
-
23
-
24
-
25
-
26
-
27
-
28
-
29
-
30
-
31
-
32
-
33
-
34
-
35
-
36
-
37
-
38
-
39
-
40
-
41
-
42
-
43
-
44
-
45
-
46
-
47
-
48
-
49
-
50
-
51
-
52
-
53
-
54
-
55
-
56
-
57
-
58
-
59
-
60
-
61
-
62
-
63
-
64
-
65
-
66
-
67
-
68
-
69
-
70
-
71
-
72
-
73
-
74
-
75
-
76
-
77
-
78
-
79
-
80
-
81
-
82
-
83
-
84
-
85
-
86
-
87
-
88
-
89
-
90
-
91
-
92
-
93
-
94
-
95
-
96
-
97
-
98
-
99
-
100
-
101
-
102
-
103
-
104
-
105
-
106
-
107
-
108
-
109
-
110
-
111
-
112
-
113
-
114
-
115
-
116
-
117
-
118
-
119
-
120
-
121
-
122
-
123
-
124
-
125
-
126
-
127
-
128
-
129
-
130
-
131
-
132
-
133
-
134
-
135
-
136
-
137
-
138
-
139
-
140
-
141
-
142
-
143
-
144
-
145
-
146
-
147
-
148
-
149
-
150
-
151
-
152
-
153
-
154
-
155
-
156
-
157
-
158
-
159
-
160
-
161
-
162
-
163
-
164
-
165
-
166
-
167
-
168
-
169
-
170
-
171
-
172
-
173
-
174
-
175
-
176
-
177
-
178
-
179
-
180
-
181
-
182
-
183
-
184
-
185
-
186
-
187
-
188
-
189
-
190
-
191
-
192
-
193
-
 194
194 -
 195
195 -
 196
196 -
 197
197 -
 198
198 -
 199
199 -
 200
200 -
 201
201 -
 202
202 -
 203
203 -
 204
204 -
 205
205 -
 206
206 -
 207
207 -
 208
208 -
 209
209 -
 210
210 -
 211
211 -
 212
212 -
 213
213 -
 214
214 -
215
-
216
-
217
-
218
-
219
-
220
-
221
-
222
-
223
-
224
-
225
-
226
-
227
-
228
-
229
-
230
-
231
-
232
-
233
-
234
-
235
-
236
-
237
-
238
-
239
-
240
-
241
-
242
-
243
-
244
-
245
-
246
-
247
-
248
-
249
-
250
-
251
-
252
-
253
-
254
-
255
-
256
-
257
-
258
-
259
-
260
-
261
-
262
-
263
-
264
-
265
-
266
-
267
-
268
-
269
-
270
-
271
-
272
-
273
-
274
-
275
-
276
-
277
-
278
-
279
-
280
-
281
-
282
-
283
-
284
 |
 |

202 Bank of America 2012
Home Equity Loans
The Corporation retains interests in home equity securitization
trusts to which it transferred home equity loans. These retained
interests include senior and subordinate securities and residual
interests. In addition, the Corporation may be obligated to provide
subordinate funding to the trusts during a rapid amortization event.
The Corporation also services the loans in the trusts. Except as
described below and in Note 8 – Representations and Warranties
Obligations and Corporate Guarantees, the Corporation does not
provide guarantees or recourse to the securitization trusts other
than standard representations and warranties. There were no
securitizations of home equity loans during 2012 and 2011. All
of the home equity trusts have entered the rapid amortization
phase, and accordingly, there were no collections reinvested in
revolving period securitizations in 2012 and 2011.
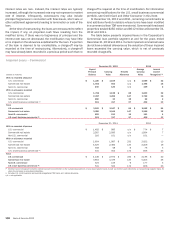
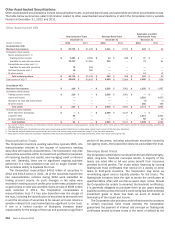
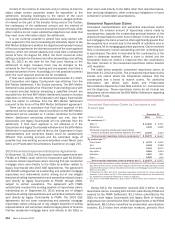
The table below summarizes select information related to home
equity loan securitization trusts in which the Corporation held a
variable interest at December 31, 2012 and 2011.
Home Equity Loan VIEs
December 31
2012 2011
(Dollars in millions)
Consolidated
VIEs
Unconsolidated
VIEs Total
Consolidated
VIEs
Unconsolidated
VIEs Total
Maximum loss exposure (1) $ 2,004 $ 6,707 $ 8,711 $ 2,672 $ 7,563 $ 10,235
On-balance sheet assets
Trading account assets $—$8$8
$—$5$5
Available-for-sale debt securities — 14 14 — 13 13
Loans and leases 2,197 — 2,197 2,975 — 2,975
Allowance for loan and lease losses (193) — (193) (303) — (303)
Total $ 2,004 $ 22 $ 2,026 $ 2,672 $ 18 $ 2,690
On-balance sheet liabilities
Long-term debt $ 2,331 $ — $ 2,331 $ 3,081 $ — $ 3,081
All other liabilities 92 — 92 66 — 66
Total $ 2,423 $ — $ 2,423 $ 3,147 $ — $ 3,147
Principal balance outstanding $ 2,197 $ 12,644 $ 14,841 $ 2,975 $ 14,422 $ 17,397
(1) For unconsolidated VIEs, the maximum loss exposure includes outstanding trust certificates issued by trusts in rapid amortization, net of recorded reserves, and excludes the liability for representations
and warranties obligations and corporate guarantees.
Included in the table above are consolidated and
unconsolidated home equity loan securitizations that have entered
a rapid amortization period and for which the Corporation is
obligated to provide subordinated funding. During this period, cash
payments from borrowers are accumulated to repay outstanding
debt securities and the Corporation continues to make advances
to borrowers when they draw on their lines of credit. The
Corporation then transfers the newly generated receivables into
the securitization vehicles and is reimbursed only after other
parties in the securitization have received all of the cash flows to
which they are entitled. If loan losses requiring draws on monoline
insurers’ policies, which protect the bondholders in the
securitization, exceed a certain level, the Corporation may not
receive reimbursement for all of the funds advanced to borrowers,
as the senior bondholders and the monoline insurers have priority
for repayment. The Corporation evaluates each of these
securitizations for potential losses due to non-recoverable
advances by estimating the amount and timing of future losses
on the underlying loans, the excess spread available to cover such
losses and potential cash flow shortfalls during rapid amortization.
This evaluation, which includes the number of loans still in revolving
status, the amount of available credit and when those loans will
lose revolving status, is also used to determine whether the
Corporation has a variable interest that is more than insignificant
and must consolidate the trust. A maximum funding obligation
attributable to rapid amortization cannot be calculated as a home
equity borrower has the ability to pay down and re-draw balances.
At December 31, 2012 and 2011, home equity loan securitizations
in rapid amortization for which the Corporation has a subordinated
funding obligation, including both consolidated and
unconsolidated trusts, had $9.0 billion and $10.7 billion of trust
certificates outstanding. This amount is significantly greater than
the amount the Corporation expects to fund. The charges that will
ultimately be recorded as a result of the rapid amortization events
depend on the undrawn available credit on the home equity lines,
which totaled $196 million and $460 million at December 31,
2012 and 2011, as well as performance of the loans, the amount
of subsequent draws and the timing of related cash flows. At
December 31, 2012 and 2011, the reserve for losses on expected
future draw obligations on the home equity loan securitizations in
rapid amortization for which the Corporation has a subordinated
funding obligation was $51 million and $69 million.
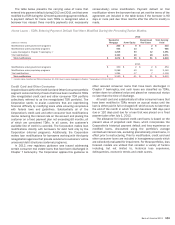
The Corporation has consumer MSRs from the sale or
securitization of home equity loans. The Corporation recorded $59
million and $62 million of servicing fee income related to home
equity loan securitizations during 2012 and 2011. The Corporation
repurchased $87 million and $28 million of loans from home equity
securitization trusts in order to perform modifications during 2012
and 2011.