Bank of America 2012 Annual Report Download - page 258
Download and view the complete annual report
Please find page 258 of the 2012 Bank of America annual report below. You can navigate through the pages in the report by either clicking on the pages listed below, or by using the keyword search tool below to find specific information within the annual report.-
 1
1 -
2
-
3
-
4
-
5
-
6
-
7
-
8
-
9
-
10
-
11
-
12
-
13
-
14
-
15
-
16
-
17
-
18
-
19
-
20
-
21
-
22
-
23
-
24
-
25
-
26
-
27
-
28
-
29
-
30
-
31
-
32
-
33
-
34
-
35
-
36
-
37
-
38
-
39
-
40
-
41
-
42
-
43
-
44
-
45
-
46
-
47
-
48
-
49
-
50
-
51
-
52
-
53
-
54
-
55
-
56
-
57
-
58
-
59
-
60
-
61
-
62
-
63
-
64
-
65
-
66
-
67
-
68
-
69
-
70
-
71
-
72
-
73
-
74
-
75
-
76
-
77
-
78
-
79
-
80
-
81
-
82
-
83
-
84
-
85
-
86
-
87
-
88
-
89
-
90
-
91
-
92
-
93
-
94
-
95
-
96
-
97
-
98
-
99
-
100
-
101
-
102
-
103
-
104
-
105
-
106
-
107
-
108
-
109
-
110
-
111
-
112
-
113
-
114
-
115
-
116
-
117
-
118
-
119
-
120
-
121
-
122
-
123
-
124
-
125
-
126
-
127
-
128
-
129
-
130
-
131
-
132
-
133
-
134
-
135
-
136
-
137
-
138
-
139
-
140
-
141
-
142
-
143
-
144
-
145
-
146
-
147
-
148
-
149
-
150
-
151
-
152
-
153
-
154
-
155
-
156
-
157
-
158
-
159
-
160
-
161
-
162
-
163
-
164
-
165
-
166
-
167
-
168
-
169
-
170
-
171
-
172
-
173
-
174
-
175
-
176
-
177
-
178
-
179
-
180
-
181
-
182
-
183
-
184
-
185
-
186
-
187
-
188
-
189
-
190
-
191
-
192
-
193
-
194
-
195
-
196
-
197
-
198
-
199
-
200
-
201
-
202
-
203
-
204
-
205
-
206
-
207
-
208
-
209
-
210
-
211
-
212
-
213
-
214
-
215
-
216
-
217
-
218
-
219
-
220
-
221
-
222
-
223
-
224
-
225
-
226
-
227
-
228
-
229
-
230
-
231
-
232
-
233
-
234
-
235
-
236
-
237
-
238
-
239
-
240
-
241
-
242
-
243
-
244
-
245
-
246
-
247
-
 248
248 -
 249
249 -
 250
250 -
 251
251 -
 252
252 -
 253
253 -
 254
254 -
 255
255 -
 256
256 -
 257
257 -
 258
258 -
 259
259 -
 260
260 -
 261
261 -
 262
262 -
 263
263 -
 264
264 -
 265
265 -
 266
266 -
 267
267 -
 268
268 -
269
-
270
-
271
-
272
-
273
-
274
-
275
-
276
-
277
-
278
-
279
-
280
-
281
-
282
-
283
-
284
 |
 |

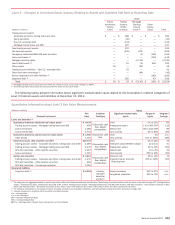
256 Bank of America 2012
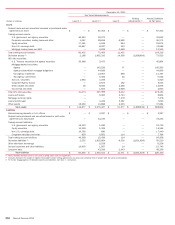
December 31, 2011
Fair Value Measurements
(Dollars in millions) Level 1 (1) Level 2 (1) Level 3
Netting
Adjustments (2)
Assets/Liabilities
at Fair Value
Assets
Federal funds sold and securities borrowed or purchased under
agreements to resell $ — $ 87,453 $ —$ — $ 87,453
Trading account assets:
U.S. government and agency securities 30,540 22,073 — — 52,613
Corporate securities, trading loans and other 1,067 28,624 6,880 — 36,571
Equity securities 17,181 5,949 544 — 23,674
Non-U.S. sovereign debt 33,667 8,937 342 — 42,946
Mortgage trading loans and ABS — 9,826 3,689 — 13,515
Total trading account assets 82,455 75,409 11,455 — 169,319
Derivative assets (3) 2,186 1,865,310 14,366 (1,808,839) 73,023
AFS debt securities:
U.S. Treasury securities and agency securities 39,389 3,475 — — 42,864
Mortgage-backed securities:
Agency — 142,526 37 — 142,563
Agency-collateralized mortgage obligations — 44,999 — — 44,999
Non-agency residential — 13,907 860 — 14,767
Non-agency commercial — 5,482 40 — 5,522
Non-U.S. securities 1,664 3,256 — — 4,920
Corporate/Agency bonds — 2,873 162 — 3,035
Other taxable securities 20 8,593 4,265 — 12,878
Tax-exempt securities — 1,955 2,648 — 4,603
Total AFS debt securities 41,073 227,066 8,012 — 276,151
Loans and leases — 6,060 2,744 — 8,804
Mortgage servicing rights — — 7,378 — 7,378
Loans held-for-sale — 4,243 3,387 — 7,630
Other assets 18,963 13,886 4,235 — 37,084
Total assets $144,677 $ 2,279,427 $ 51,577 $ (1,808,839) $ 666,842
Liabilities
Interest-bearing deposits in U.S. offices $ — $ 3,297 $ —$ — $ 3,297
Federal funds purchased and securities loaned or sold under
agreements to repurchase — 34,235 — — 34,235
Trading account liabilities:
U.S. government and agency securities 19,120 1,590 — — 20,710
Equity securities 13,259 1,335 — — 14,594
Non-U.S. sovereign debt 16,760 680 — — 17,440
Corporate securities and other 829 6,821 114 — 7,764
Total trading account liabilities 49,968 10,426 114 — 60,508
Derivative liabilities (3) 2,055 1,850,804 8,500 (1,801,839) 59,520
Other short-term borrowings — 6,558 — — 6,558
Accrued expenses and other liabilities 13,832 1,897 14 — 15,743
Long-term debt — 43,296 2,943 — 46,239
Total liabilities $ 65,855 $ 1,950,513 $ 11,571 $ (1,801,839) $ 226,100
(1) Gross transfers between Level 1 and Level 2 during 2011 were not significant.
(2) Amounts represent the impact of legally enforceable master netting agreements and also cash collateral held or placed with the same counterparties.
(3) For further disaggregation of derivative assets and liabilities, see Note 3 – Derivatives.