Bank of America 2012 Annual Report Download - page 187
Download and view the complete annual report
Please find page 187 of the 2012 Bank of America annual report below. You can navigate through the pages in the report by either clicking on the pages listed below, or by using the keyword search tool below to find specific information within the annual report.-
 1
1 -
2
-
3
-
4
-
5
-
6
-
7
-
8
-
9
-
10
-
11
-
12
-
13
-
14
-
15
-
16
-
17
-
18
-
19
-
20
-
21
-
22
-
23
-
24
-
25
-
26
-
27
-
28
-
29
-
30
-
31
-
32
-
33
-
34
-
35
-
36
-
37
-
38
-
39
-
40
-
41
-
42
-
43
-
44
-
45
-
46
-
47
-
48
-
49
-
50
-
51
-
52
-
53
-
54
-
55
-
56
-
57
-
58
-
59
-
60
-
61
-
62
-
63
-
64
-
65
-
66
-
67
-
68
-
69
-
70
-
71
-
72
-
73
-
74
-
75
-
76
-
77
-
78
-
79
-
80
-
81
-
82
-
83
-
84
-
85
-
86
-
87
-
88
-
89
-
90
-
91
-
92
-
93
-
94
-
95
-
96
-
97
-
98
-
99
-
100
-
101
-
102
-
103
-
104
-
105
-
106
-
107
-
108
-
109
-
110
-
111
-
112
-
113
-
114
-
115
-
116
-
117
-
118
-
119
-
120
-
121
-
122
-
123
-
124
-
125
-
126
-
127
-
128
-
129
-
130
-
131
-
132
-
133
-
134
-
135
-
136
-
137
-
138
-
139
-
140
-
141
-
142
-
143
-
144
-
145
-
146
-
147
-
148
-
149
-
150
-
151
-
152
-
153
-
154
-
155
-
156
-
157
-
158
-
159
-
160
-
161
-
162
-
163
-
164
-
165
-
166
-
167
-
168
-
169
-
170
-
171
-
172
-
173
-
174
-
175
-
176
-
 177
177 -
 178
178 -
 179
179 -
 180
180 -
 181
181 -
 182
182 -
 183
183 -
 184
184 -
 185
185 -
 186
186 -
 187
187 -
 188
188 -
 189
189 -
 190
190 -
 191
191 -
 192
192 -
 193
193 -
 194
194 -
 195
195 -
 196
196 -
 197
197 -
198
-
199
-
200
-
201
-
202
-
203
-
204
-
205
-
206
-
207
-
208
-
209
-
210
-
211
-
212
-
213
-
214
-
215
-
216
-
217
-
218
-
219
-
220
-
221
-
222
-
223
-
224
-
225
-
226
-
227
-
228
-
229
-
230
-
231
-
232
-
233
-
234
-
235
-
236
-
237
-
238
-
239
-
240
-
241
-
242
-
243
-
244
-
245
-
246
-
247
-
248
-
249
-
250
-
251
-
252
-
253
-
254
-
255
-
256
-
257
-
258
-
259
-
260
-
261
-
262
-
263
-
264
-
265
-
266
-
267
-
268
-
269
-
270
-
271
-
272
-
273
-
274
-
275
-
276
-
277
-
278
-
279
-
280
-
281
-
282
-
283
-
284
 |
 |

Bank of America 2012 185
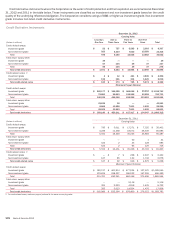
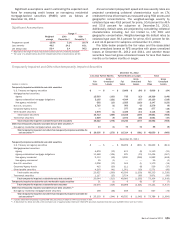
December 31, 2011
(Dollars in millions)
30-59 Days
Past Due (1)
60-89 Days
Past Due (1)
90 Days or
More
Past Due (2)
Total Past
Due 30 Days
or More
Total Current
or Less Than
30 Days
Past Due (3)
Purchased
Credit-
impaired (4)
Loans
Accounted
for Under
the Fair
Value Option
Total
Outstandings
Home loans
Core portfolio
Residential mortgage (5) $ 2,151 $ 751 $ 3,017 $ 5,919 $ 172,418 $ 178,337
Home equity 260 155 429 844 66,211 67,055
Legacy Assets & Servicing portfolio
Residential mortgage 3,195 2,174 32,167 37,536 36,451 $ 9,966 83,953
Home equity 845 508 1,735 3,088 42,578 11,978 57,644
Discontinued real estate (6) 65 24 351 440 798 9,857 11,095
Credit card and other consumer
U.S. credit card 981 772 2,070 3,823 98,468 102,291
Non-U.S. credit card 148 120 342 610 13,808 14,418
Direct/Indirect consumer (7) 805 338 779 1,922 87,791 89,713
Other consumer (8) 55 21 17 93 2,595 2,688
Total consumer loans 8,505 4,863 40,907 54,275 521,118 31,801 607,194
Consumer loans accounted for
under the fair value option (9) $ 2,190 2,190
Total consumer 8,505 4,863 40,907 54,275 521,118 31,801 2,190 609,384
Commercial
U.S. commercial 352 166 866 1,384 178,564 179,948
Commercial real estate (10) 288 118 1,860 2,266 37,330 39,596
Commercial lease financing 78 15 22 115 21,874 21,989
Non-U.S. commercial 24 — — 24 55,394 55,418
U.S. small business commercial 150 106 272 528 12,723 13,251
Total commercial loans 892 405 3,020 4,317 305,885 310,202
Commercial loans accounted for
under the fair value option (9) 6,614 6,614
Total commercial 892 405 3,020 4,317 305,885 6,614 316,816
Total loans and leases $ 9,397 $ 5,268 $ 43,927 $ 58,592 $ 827,003 $ 31,801 $ 8,804 $ 926,200
Percentage of outstandings 1.02% 0.57% 4.74% 6.33% 89.29% 3.43% 0.95%
(1) Home loans 30-59 days past due includes $2.2 billion of fully-insured loans and $372 million of nonperforming loans. Home loans 60-89 days past due includes $1.4 billion of fully-insured loans
and $398 million of nonperforming loans.
(2) Home loans includes $21.2 billion of fully-insured loans.
(3) Home loans includes $1.8 billion and direct/indirect consumer includes $7 million of nonperforming loans.
(4) PCI loan amounts are shown gross of the valuation allowance.
(5) Total outstandings includes non-U.S. residential mortgage loans of $85 million.
(6) Total outstandings includes $9.9 billion of pay option loans and $1.2 billion of subprime loans. The Corporation no longer originates these products.
(7) Total outstandings includes dealer financial services loans of $43.0 billion, consumer lending loans of $8.0 billion, U.S. securities-based lending margin loans of $23.6 billion, student loans of $6.0
billion, non-U.S. consumer loans of $7.6 billion and other consumer loans of $1.5 billion.
(8) Total outstandings includes consumer finance loans of $1.7 billion, other non-U.S. consumer loans of $929 million and consumer overdrafts of $103 million.
(9) Consumer loans accounted for under the fair value option were residential mortgage loans of $906 million and discontinued real estate loans of $1.3 billion. Commercial loans accounted for under
the fair value option were U.S. commercial loans of $2.2 billion and non-U.S. commercial loans of $4.4 billion. For additional information, see Note 21 – Fair Value Measurements and Note 22 – Fair
Value Option.
(10) Total outstandings includes U.S. commercial real estate loans of $37.8 billion and non-U.S. commercial real estate loans of $1.8 billion.