Bank of America 2012 Annual Report Download - page 137
Download and view the complete annual report
Please find page 137 of the 2012 Bank of America annual report below. You can navigate through the pages in the report by either clicking on the pages listed below, or by using the keyword search tool below to find specific information within the annual report.-
 1
1 -
2
-
3
-
4
-
5
-
6
-
7
-
8
-
9
-
10
-
11
-
12
-
13
-
14
-
15
-
16
-
17
-
18
-
19
-
20
-
21
-
22
-
23
-
24
-
25
-
26
-
27
-
28
-
29
-
30
-
31
-
32
-
33
-
34
-
35
-
36
-
37
-
38
-
39
-
40
-
41
-
42
-
43
-
44
-
45
-
46
-
47
-
48
-
49
-
50
-
51
-
52
-
53
-
54
-
55
-
56
-
57
-
58
-
59
-
60
-
61
-
62
-
63
-
64
-
65
-
66
-
67
-
68
-
69
-
70
-
71
-
72
-
73
-
74
-
75
-
76
-
77
-
78
-
79
-
80
-
81
-
82
-
83
-
84
-
85
-
86
-
87
-
88
-
89
-
90
-
91
-
92
-
93
-
94
-
95
-
96
-
97
-
98
-
99
-
100
-
101
-
102
-
103
-
104
-
105
-
106
-
107
-
108
-
109
-
110
-
111
-
112
-
113
-
114
-
115
-
116
-
117
-
118
-
119
-
120
-
121
-
122
-
123
-
124
-
125
-
126
-
 127
127 -
 128
128 -
 129
129 -
 130
130 -
 131
131 -
 132
132 -
 133
133 -
 134
134 -
 135
135 -
 136
136 -
 137
137 -
 138
138 -
 139
139 -
 140
140 -
 141
141 -
 142
142 -
 143
143 -
 144
144 -
 145
145 -
 146
146 -
 147
147 -
148
-
149
-
150
-
151
-
152
-
153
-
154
-
155
-
156
-
157
-
158
-
159
-
160
-
161
-
162
-
163
-
164
-
165
-
166
-
167
-
168
-
169
-
170
-
171
-
172
-
173
-
174
-
175
-
176
-
177
-
178
-
179
-
180
-
181
-
182
-
183
-
184
-
185
-
186
-
187
-
188
-
189
-
190
-
191
-
192
-
193
-
194
-
195
-
196
-
197
-
198
-
199
-
200
-
201
-
202
-
203
-
204
-
205
-
206
-
207
-
208
-
209
-
210
-
211
-
212
-
213
-
214
-
215
-
216
-
217
-
218
-
219
-
220
-
221
-
222
-
223
-
224
-
225
-
226
-
227
-
228
-
229
-
230
-
231
-
232
-
233
-
234
-
235
-
236
-
237
-
238
-
239
-
240
-
241
-
242
-
243
-
244
-
245
-
246
-
247
-
248
-
249
-
250
-
251
-
252
-
253
-
254
-
255
-
256
-
257
-
258
-
259
-
260
-
261
-
262
-
263
-
264
-
265
-
266
-
267
-
268
-
269
-
270
-
271
-
272
-
273
-
274
-
275
-
276
-
277
-
278
-
279
-
280
-
281
-
282
-
283
-
284
 |
 |

Bank of America 2012 135
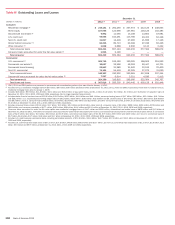
Table IX Selected Loan Maturity Data (1, 2)
December 31, 2012
(Dollars in millions)
Due in One
Year or Less
Due After
One Year
Through
Five Years
Due After
Five Years Total
U.S. commercial $ 60,018 $ 108,191 $ 43,760 $ 211,969
U.S. commercial real estate 9,043 23,037 5,075 37,155
Non-U.S. and other (3) 63,326 12,605 5,482 81,413
Total selected loans $ 132,387 $ 143,833 $ 54,317 $ 330,537
Percent of total 40% 44% 16% 100%
Sensitivity of selected loans to changes in interest rates for loans due after one year:
Fixed interest rates $ 10,531 $ 27,378
Floating or adjustable interest rates 133,302 26,939
Total $ 143,833 $ 54,317
(1) Loan maturities are based on the remaining maturities under contractual terms.
(2) Includes loans accounted for under the fair value option.
(3) Loan maturities include non-U.S. commercial and commercial real estate loans.
Table X Non-exchange Traded Commodity Contracts
December 31, 2012
(Dollars in millions)
Asset
Positions
Liability
Positions
Net fair value of contracts outstanding, January 1, 2012 $ 5,508 $ 4,585
Effects of legally enforceable master netting agreements 8,399 8,399
Gross fair value of contracts outstanding, January 1, 2012 13,907 12,984
Contracts realized or otherwise settled (8,755) (7,926)
Fair value of new contracts 4,364 4,294
Other changes in fair value (365) (265)
Gross fair value of contracts outstanding, December 31, 2012 9,151 9,087
Effects of legally enforceable master netting agreements (5,110) (5,110)
Net fair value of contracts outstanding, December 31, 2012 $ 4,041 $ 3,977
Table XI Non-exchange Traded Commodity Contract Maturities
December 31, 2012
(Dollars in millions)
Asset
Positions
Liability
Positions
Less than one year $ 5,494 $ 5,229
Greater than or equal to one year and less than three years 2,103 2,383
Greater than or equal to three years and less than five years 603 519
Greater than or equal to five years 951 956
Gross fair value of contracts outstanding 9,151 9,087
Effects of legally enforceable master netting agreements (5,110) (5,110)
Net fair value of contracts outstanding $ 4,041 $ 3,977