Bank of America 2012 Annual Report Download - page 140
Download and view the complete annual report
Please find page 140 of the 2012 Bank of America annual report below. You can navigate through the pages in the report by either clicking on the pages listed below, or by using the keyword search tool below to find specific information within the annual report.-
 1
1 -
2
-
3
-
4
-
5
-
6
-
7
-
8
-
9
-
10
-
11
-
12
-
13
-
14
-
15
-
16
-
17
-
18
-
19
-
20
-
21
-
22
-
23
-
24
-
25
-
26
-
27
-
28
-
29
-
30
-
31
-
32
-
33
-
34
-
35
-
36
-
37
-
38
-
39
-
40
-
41
-
42
-
43
-
44
-
45
-
46
-
47
-
48
-
49
-
50
-
51
-
52
-
53
-
54
-
55
-
56
-
57
-
58
-
59
-
60
-
61
-
62
-
63
-
64
-
65
-
66
-
67
-
68
-
69
-
70
-
71
-
72
-
73
-
74
-
75
-
76
-
77
-
78
-
79
-
80
-
81
-
82
-
83
-
84
-
85
-
86
-
87
-
88
-
89
-
90
-
91
-
92
-
93
-
94
-
95
-
96
-
97
-
98
-
99
-
100
-
101
-
102
-
103
-
104
-
105
-
106
-
107
-
108
-
109
-
110
-
111
-
112
-
113
-
114
-
115
-
116
-
117
-
118
-
119
-
120
-
121
-
122
-
123
-
124
-
125
-
126
-
127
-
128
-
129
-
 130
130 -
 131
131 -
 132
132 -
 133
133 -
 134
134 -
 135
135 -
 136
136 -
 137
137 -
 138
138 -
 139
139 -
 140
140 -
 141
141 -
 142
142 -
 143
143 -
 144
144 -
 145
145 -
 146
146 -
 147
147 -
 148
148 -
 149
149 -
 150
150 -
151
-
152
-
153
-
154
-
155
-
156
-
157
-
158
-
159
-
160
-
161
-
162
-
163
-
164
-
165
-
166
-
167
-
168
-
169
-
170
-
171
-
172
-
173
-
174
-
175
-
176
-
177
-
178
-
179
-
180
-
181
-
182
-
183
-
184
-
185
-
186
-
187
-
188
-
189
-
190
-
191
-
192
-
193
-
194
-
195
-
196
-
197
-
198
-
199
-
200
-
201
-
202
-
203
-
204
-
205
-
206
-
207
-
208
-
209
-
210
-
211
-
212
-
213
-
214
-
215
-
216
-
217
-
218
-
219
-
220
-
221
-
222
-
223
-
224
-
225
-
226
-
227
-
228
-
229
-
230
-
231
-
232
-
233
-
234
-
235
-
236
-
237
-
238
-
239
-
240
-
241
-
242
-
243
-
244
-
245
-
246
-
247
-
248
-
249
-
250
-
251
-
252
-
253
-
254
-
255
-
256
-
257
-
258
-
259
-
260
-
261
-
262
-
263
-
264
-
265
-
266
-
267
-
268
-
269
-
270
-
271
-
272
-
273
-
274
-
275
-
276
-
277
-
278
-
279
-
280
-
281
-
282
-
283
-
284
 |
 |

138 Bank of America 2012
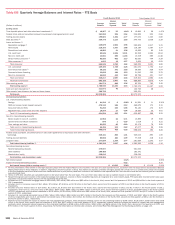
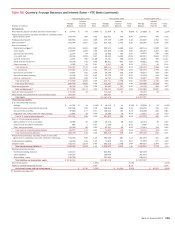
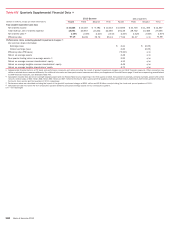
Table XIII Quarterly Average Balances and Interest Rates – FTE Basis
Fourth Quarter 2012 Third Quarter 2012
(Dollars in millions)
Average
Balance
Interest
Income/
Expense
Yield/
Rate
Average
Balance
Interest
Income/
Expense
Yield/
Rate
Earning assets
Time deposits placed and other short-term investments (1) $ 16,967 $ 50 1.14% $15,849 $ 58 1.47%
Federal funds sold and securities borrowed or purchased under agreements to resell 241,950 329 0.54 234,955 353 0.60
Trading account assets 195,800 1,362 2.77 177,075 1,243 2.80
Debt securities (2) 339,779 2,123 2.50 340,773 2,036 2.39
Loans and leases (3):
Residential mortgage (4) 245,879 2,202 3.58 250,505 2,317 3.70
Home equity 110,105 1,067 3.86 116,184 1,097 3.77
Discontinued real estate 10,850 91 3.36 10,956 95 3.45
U.S. credit card 92,849 2,336 10.01 93,292 2,353 10.04
Non-U.S. credit card 13,081 383 11.66 13,329 385 11.48
Direct/Indirect consumer (5) 82,583 662 3.19 82,635 704 3.39
Other consumer (6) 1,602 19 4.57 2,654 40 6.03
Total consumer 556,949 6,760 4.84 569,555 6,991 4.89
U.S. commercial 209,496 1,729 3.28 201,072 1,752 3.47
Commercial real estate (7) 38,192 341 3.55 36,929 329 3.54
Commercial lease financing 22,839 184 3.23 21,545 202 3.75
Non-U.S. commercial 65,690 433 2.62 59,758 401 2.67
Total commercial 336,217 2,687 3.18 319,304 2,684 3.35
Total loans and leases 893,166 9,447 4.21 888,859 9,675 4.34
Other earning assets 101,274 849 3.34 92,764 792 3.40
Total earning assets (8) 1,788,936 14,160 3.16 1,750,275 14,157 3.22
Cash and cash equivalents (1) 111,671 42 122,716 48
Other assets, less allowance for loan and lease losses 309,758 300,321
Total assets $ 2,210,365 $2,173,312
Interest-bearing liabilities
U.S. interest-bearing deposits:
Savings $ 41,294 $ 6 0.06% $41,581 $ 11 0.10%
NOW and money market deposit accounts 479,130 146 0.12 465,679 173 0.15
Consumer CDs and IRAs 91,256 156 0.68 94,140 172 0.73
Negotiable CDs, public funds and other deposits 19,904 27 0.54 19,587 30 0.61
Total U.S. interest-bearing deposits 631,584 335 0.21 620,987 386 0.25
Non-U.S. interest-bearing deposits:
Banks located in non-U.S. countries 11,964 22 0.71 13,883 19 0.56
Governments and official institutions 876 1 0.29 1,019 1 0.31
Time, savings and other 53,655 80 0.60 52,175 78 0.59
Total non-U.S. interest-bearing deposits 66,495 103 0.62 67,077 98 0.58
Total interest-bearing deposits 698,079 438 0.25 688,064 484 0.28
Federal funds purchased, securities loaned or sold under agreements to repurchase and other short-term
borrowings 336,341 855 1.01 325,023 893 1.09
Trading account liabilities 80,084 420 2.09 77,528 418 2.14
Long-term debt 277,894 1,934 2.77 291,684 2,243 3.07
Total interest-bearing liabilities (8) 1,392,398 3,647 1.04 1,382,299 4,038 1.16
Noninterest-bearing sources:
Noninterest-bearing deposits 379,997 361,633
Other liabilities 199,458 193,341
Shareholders’ equity 238,512 236,039
Total liabilities and shareholders’ equity $ 2,210,365 $2,173,312
Net interest spread 2.12% 2.06%
Impact of noninterest-bearing sources 0.22 0.25
Net interest income/yield on earning assets (1) $ 10,513 2.34% $ 10,119 2.31%
(1) For this presentation, fees earned on overnight deposits placed with the Federal Reserve are included in the cash and cash equivalents line, consistent with the Corporation’s Consolidated Balance
Sheet presentation of these deposits. In addition, beginning in the third quarter of 2012, fees earned on deposits, primarily overnight, placed with certain non-U.S. central banks, which are included
in the time deposits placed and other short-term investments line in prior periods, have been included in the cash and cash equivalents line. Net interest income and net interest yield are calculated
excluding these fees.
(2) Yields on AFS debt securities are calculated based on fair value rather than the cost basis. The use of fair value does not have a material impact on net interest yield.
(3) Nonperforming loans are included in the respective average loan balances. Income on these nonperforming loans is recognized on a cost recovery basis. PCI loans were recorded at fair value upon
acquisition and accrete interest income over the remaining life of the loan.
(4) Includes non-U.S. residential mortgage loans of $93 million, $92 million, $89 million and $86 million in the fourth, third, second and first quarters of 2012, and $88 million in the fourth quarter of
2011, respectively.
(5) Includes non-U.S. consumer loans of $8.1 billion, $7.8 billion, $7.8 billion and $7.5 billion in the fourth, third, second and first quarters of 2012, and $8.4 billion in the fourth quarter of 2011,
respectively.
(6) Includes consumer finance loans of $1.4 billion, $1.5 billion, $1.6 billion and $1.6 billion in the fourth, third, second and first quarters of 2012, and $1.7 billion in the fourth quarter of 2011,
respectively; other non-U.S. consumer loans of $4 million, $997 million, $895 million and $903 million in the fourth, third, second and first quarters of 2012, and $959 million in the fourth quarter
of 2011, respectively; and consumer overdrafts of $156 million, $158 million, $108 million and $90 million in the fourth, third, second and first quarters of 2012, and $107 million in the fourth
quarter of 2011, respectively.
(7) Includes U.S. commercial real estate loans of $36.7 billion, $35.4 billion, $36.0 billion and $37.4 billion in the fourth, third, second and first quarters of 2012, and $38.7 billion in the fourth quarter
of 2011, respectively; and non-U.S. commercial real estate loans of $1.5 billion, $1.5 billion, $1.6 billion and $1.8 billion in the fourth, third, second and first quarters of 2012, and $1.9 billion in
the fourth quarter of 2011, respectively.
(8) Interest income includes the impact of interest rate risk management contracts, which decreased interest income on the underlying assets by $146 million, $136 million, $366 million and $106
million in the fourth, third, second and first quarters of 2012, and $427 million in the fourth quarter of 2011, respectively. Interest expense includes the impact of interest rate risk management
contracts, which decreased interest expense on the underlying liabilities by $598 million, $454 million, $591 million and $658 million in the fourth, third, second and first quarters of 2012, and
$763 million in the fourth quarter of 2011, respectively. For further information on interest rate contracts, see Interest Rate Risk Management for Nontrading Activities on page 113.