Bank of America 2012 Annual Report Download - page 189
Download and view the complete annual report
Please find page 189 of the 2012 Bank of America annual report below. You can navigate through the pages in the report by either clicking on the pages listed below, or by using the keyword search tool below to find specific information within the annual report.-
 1
1 -
2
-
3
-
4
-
5
-
6
-
7
-
8
-
9
-
10
-
11
-
12
-
13
-
14
-
15
-
16
-
17
-
18
-
19
-
20
-
21
-
22
-
23
-
24
-
25
-
26
-
27
-
28
-
29
-
30
-
31
-
32
-
33
-
34
-
35
-
36
-
37
-
38
-
39
-
40
-
41
-
42
-
43
-
44
-
45
-
46
-
47
-
48
-
49
-
50
-
51
-
52
-
53
-
54
-
55
-
56
-
57
-
58
-
59
-
60
-
61
-
62
-
63
-
64
-
65
-
66
-
67
-
68
-
69
-
70
-
71
-
72
-
73
-
74
-
75
-
76
-
77
-
78
-
79
-
80
-
81
-
82
-
83
-
84
-
85
-
86
-
87
-
88
-
89
-
90
-
91
-
92
-
93
-
94
-
95
-
96
-
97
-
98
-
99
-
100
-
101
-
102
-
103
-
104
-
105
-
106
-
107
-
108
-
109
-
110
-
111
-
112
-
113
-
114
-
115
-
116
-
117
-
118
-
119
-
120
-
121
-
122
-
123
-
124
-
125
-
126
-
127
-
128
-
129
-
130
-
131
-
132
-
133
-
134
-
135
-
136
-
137
-
138
-
139
-
140
-
141
-
142
-
143
-
144
-
145
-
146
-
147
-
148
-
149
-
150
-
151
-
152
-
153
-
154
-
155
-
156
-
157
-
158
-
159
-
160
-
161
-
162
-
163
-
164
-
165
-
166
-
167
-
168
-
169
-
170
-
171
-
172
-
173
-
174
-
175
-
176
-
177
-
178
-
 179
179 -
 180
180 -
 181
181 -
 182
182 -
 183
183 -
 184
184 -
 185
185 -
 186
186 -
 187
187 -
 188
188 -
 189
189 -
 190
190 -
 191
191 -
 192
192 -
 193
193 -
 194
194 -
 195
195 -
 196
196 -
 197
197 -
 198
198 -
 199
199 -
200
-
201
-
202
-
203
-
204
-
205
-
206
-
207
-
208
-
209
-
210
-
211
-
212
-
213
-
214
-
215
-
216
-
217
-
218
-
219
-
220
-
221
-
222
-
223
-
224
-
225
-
226
-
227
-
228
-
229
-
230
-
231
-
232
-
233
-
234
-
235
-
236
-
237
-
238
-
239
-
240
-
241
-
242
-
243
-
244
-
245
-
246
-
247
-
248
-
249
-
250
-
251
-
252
-
253
-
254
-
255
-
256
-
257
-
258
-
259
-
260
-
261
-
262
-
263
-
264
-
265
-
266
-
267
-
268
-
269
-
270
-
271
-
272
-
273
-
274
-
275
-
276
-
277
-
278
-
279
-
280
-
281
-
282
-
283
-
284
 |
 |

Bank of America 2012 187
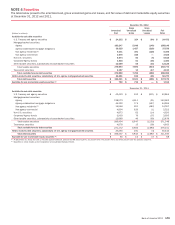
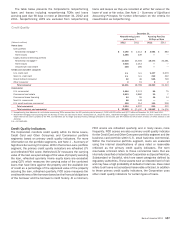
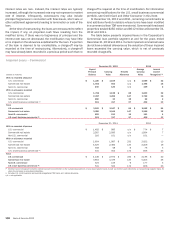
The table below presents the Corporation’s nonperforming
loans and leases including nonperforming TDRs and loans
accruing past due 90 days or more at December 31, 2012 and
2011. Nonperforming LHFS are excluded from nonperforming
loans and leases as they are recorded at either fair value or the
lower of cost or fair value. See Note 1 – Summary of Significant
Accounting Principles for further information on the criteria for
classification as nonperforming.
Credit Quality
December 31
Nonperforming Loans
and Leases (1)
Accruing Past Due
90 Days or More
(Dollars in millions) 2012 2011 2012 2011
Home loans
Core portfolio
Residential mortgage (2) $ 3,190 $ 2,414 $ 3,984 $ 883
Home equity 1,265 439 ——
Legacy Assets & Servicing portfolio
Residential mortgage (2) 11,618 13,556 18,173 20,281
Home equity 3,016 2,014 ——
Discontinued real estate 248 290 ——
Credit card and other consumer
U.S. credit card n/a n/a 1,437 2,070
Non-U.S. credit card n/a n/a 212 342
Direct/Indirect consumer 92 40 545 746
Other consumer 215 22
Total consumer 19,431 18,768 24,353 24,324
Commercial
U.S. commercial 1,484 2,174 65 75
Commercial real estate 1,513 3,880 29 7
Commercial lease financing 44 26 15 14
Non-U.S. commercial 68 143 ——
U.S. small business commercial 115 114 120 216
Total commercial 3,224 6,337 229 312
Total consumer and commercial $ 22,655 $ 25,105 $24,582 $ 24,636
(1) Nonperforming loan balances do not include nonaccruing TDRs removed from the PCI portfolio prior to January 1, 2010 of $521 million and $477 million at December 31, 2012 and 2011.
(2) Residential mortgage loans accruing past due 90 days or more are fully-insured loans. At December 31, 2012 and 2011, residential mortgage includes $17.8 billion and $17.0 billion of loans on
which interest has been curtailed by the FHA, and therefore are no longer accruing interest, although principal is still insured, and $4.4 billion and $4.2 billion of loans on which interest is still
accruing.
n/a = not applicable
Credit Quality Indicators
The Corporation monitors credit quality within its Home Loans,
Credit Card and Other Consumer, and Commercial portfolio
segments based on primary credit quality indicators. For more
information on the portfolio segments, see Note 1 – Summary of
Significant Accounting Principles. Within the Home Loans portfolio
segment, the primary credit quality indicators are refreshed LTV
and refreshed FICO score. Refreshed LTV measures the carrying
value of the loan as a percentage of the value of property securing
the loan, refreshed quarterly. Home equity loans are evaluated
using CLTV which measures the carrying value of the combined
loans that have liens against the property and the available line
of credit as a percentage of the appraised value of the property
securing the loan, refreshed quarterly. FICO score measures the
creditworthiness of the borrower based on the financial obligations
of the borrower and the borrower’s credit history. At a minimum,
FICO scores are refreshed quarterly, and in many cases, more
frequently. FICO scores are also a primary credit quality indicator
for the Credit Card and Other Consumer portfolio segment and the
business card portfolio within U.S. small business commercial.
Within the Commercial portfolio segment, loans are evaluated
using the internal classifications of pass rated or reservable
criticized as the primary credit quality indicators. The term
reservable criticized refers to those commercial loans that are
internally classified or listed by the Corporation as Special Mention,
Substandard or Doubtful, which are asset categories defined by
regulatory authorities. These assets have an elevated level of risk
and may have a high probability of default or total loss. Pass rated
refers to all loans not considered reservable criticized. In addition
to these primary credit quality indicators, the Corporation uses
other credit quality indicators for certain types of loans.