Bank of America 2012 Annual Report Download - page 139
Download and view the complete annual report
Please find page 139 of the 2012 Bank of America annual report below. You can navigate through the pages in the report by either clicking on the pages listed below, or by using the keyword search tool below to find specific information within the annual report.-
 1
1 -
2
-
3
-
4
-
5
-
6
-
7
-
8
-
9
-
10
-
11
-
12
-
13
-
14
-
15
-
16
-
17
-
18
-
19
-
20
-
21
-
22
-
23
-
24
-
25
-
26
-
27
-
28
-
29
-
30
-
31
-
32
-
33
-
34
-
35
-
36
-
37
-
38
-
39
-
40
-
41
-
42
-
43
-
44
-
45
-
46
-
47
-
48
-
49
-
50
-
51
-
52
-
53
-
54
-
55
-
56
-
57
-
58
-
59
-
60
-
61
-
62
-
63
-
64
-
65
-
66
-
67
-
68
-
69
-
70
-
71
-
72
-
73
-
74
-
75
-
76
-
77
-
78
-
79
-
80
-
81
-
82
-
83
-
84
-
85
-
86
-
87
-
88
-
89
-
90
-
91
-
92
-
93
-
94
-
95
-
96
-
97
-
98
-
99
-
100
-
101
-
102
-
103
-
104
-
105
-
106
-
107
-
108
-
109
-
110
-
111
-
112
-
113
-
114
-
115
-
116
-
117
-
118
-
119
-
120
-
121
-
122
-
123
-
124
-
125
-
126
-
127
-
128
-
 129
129 -
 130
130 -
 131
131 -
 132
132 -
 133
133 -
 134
134 -
 135
135 -
 136
136 -
 137
137 -
 138
138 -
 139
139 -
 140
140 -
 141
141 -
 142
142 -
 143
143 -
 144
144 -
 145
145 -
 146
146 -
 147
147 -
 148
148 -
 149
149 -
150
-
151
-
152
-
153
-
154
-
155
-
156
-
157
-
158
-
159
-
160
-
161
-
162
-
163
-
164
-
165
-
166
-
167
-
168
-
169
-
170
-
171
-
172
-
173
-
174
-
175
-
176
-
177
-
178
-
179
-
180
-
181
-
182
-
183
-
184
-
185
-
186
-
187
-
188
-
189
-
190
-
191
-
192
-
193
-
194
-
195
-
196
-
197
-
198
-
199
-
200
-
201
-
202
-
203
-
204
-
205
-
206
-
207
-
208
-
209
-
210
-
211
-
212
-
213
-
214
-
215
-
216
-
217
-
218
-
219
-
220
-
221
-
222
-
223
-
224
-
225
-
226
-
227
-
228
-
229
-
230
-
231
-
232
-
233
-
234
-
235
-
236
-
237
-
238
-
239
-
240
-
241
-
242
-
243
-
244
-
245
-
246
-
247
-
248
-
249
-
250
-
251
-
252
-
253
-
254
-
255
-
256
-
257
-
258
-
259
-
260
-
261
-
262
-
263
-
264
-
265
-
266
-
267
-
268
-
269
-
270
-
271
-
272
-
273
-
274
-
275
-
276
-
277
-
278
-
279
-
280
-
281
-
282
-
283
-
284
 |
 |

Bank of America 2012 137
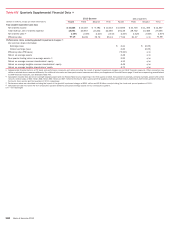
Table XII Selected Quarterly Financial Data (continued)
2012 Quarters 2011 Quarters
(Dollars in millions) Fourth Third Second First Fourth Third Second First
Average balance sheet
Total loans and leases $ 893,166 $ 888,859 $ 899,498 $ 913,722 $ 932,898 $ 942,032 $ 938,513 $ 938,966
Total assets 2,210,365 2,173,312 2,194,563 2,187,174 2,207,567 2,301,454 2,339,110 2,338,538
Total deposits 1,078,076 1,049,697 1,032,888 1,030,112 1,032,531 1,051,320 1,035,944 1,023,140
Long-term debt 277,894 291,684 333,173 363,518 389,557 420,273 435,144 440,511
Common shareholders’ equity 219,744 217,273 216,782 214,150 209,324 204,928 218,505 214,206
Total shareholders’ equity 238,512 236,039 235,558 232,566 228,235 222,410 235,067 230,769
Asset quality (5)
Allowance for credit losses (6) $ 24,692 $ 26,751 $ 30,862 $ 32,862 $ 34,497 $ 35,872 $ 38,209 $ 40,804
Nonperforming loans, leases and foreclosed properties (7) 23,555 24,925 25,377 27,790 27,708 29,059 30,058 31,643
Allowance for loan and lease losses as a percentage of total loans
and leases outstanding (7) 2.69% 2.96% 3.43% 3.61% 3.68% 3.81% 4.00% 4.29%
Allowance for loan and lease losses as a percentage of total
nonperforming loans and leases (7) 107 111 127 126 135 133 135 135
Allowance for loan and lease losses as a percentage of total
nonperforming loans and leases, excluding the PCI loan
portfolio (6) 82 81 90 91 101 101 105 108
Amounts included in allowance that are excluded from
nonperforming loans and leases (8) $ 12,021 $ 13,978 $ 16,327 $ 17,006 $ 17,490 $ 18,317 $ 19,935 $ 22,110
Allowance as a percentage of total nonperforming loans and
leases, excluding amounts included in the allowance that are
excluded from nonperforming loans and leases (8) 54% 52% 59% 60% 65% 63% 63% 60%
Net charge-offs (9) $ 3,104 $ 4,122 $ 3,626 $ 4,056 $ 4,054 $ 5,086 $ 5,665 $ 6,028
Annualized net charge-offs as a percentage of average loans and
leases outstanding (7, 9) 1.40% 1.86% 1.64% 1.80% 1.74% 2.17% 2.44% 2.61%
Annualized net charge-offs as a percentage of average loans and
leases outstanding, excluding the PCI loan portfolio (7) 1.44 1.93 1.69 1.87 1.81 2.25 2.54 2.71
Annualized net charge-offs and PCI write-offs as a percentage of
average loans and leases outstanding (7, 10) 1.90 2.63 1.64 1.80 1.74 2.17 2.44 2.61
Nonperforming loans and leases as a percentage of total loans and
leases outstanding (7) 2.52 2.68 2.70 2.85 2.74 2.87 2.96 3.19
Nonperforming loans, leases and foreclosed properties as a
percentage of total loans, leases and foreclosed properties (7) 2.62 2.81 2.87 3.10 3.01 3.15 3.22 3.40
Ratio of the allowance for loan and lease losses at period end to
annualized net charge-offs (9) 1.96 1.60 2.08 1.97 2.10 1.74 1.64 1.63
Ratio of the allowance for loan and lease losses at period end to
annualized net charge-offs, excluding the PCI loan portfolio 1.51 1.17 1.46 1.43 1.57 1.33 1.28 1.31
Ratio of the allowance for loan and lease losses at period end to
annualized net charge-offs and PCI write-offs (10) 1.44 1.13 2.08 1.97 2.10 1.74 1.64 1.63
Capital ratios (period end)
Risk-based capital:
Tier 1 common 11.06% 11.41% 11.24% 10.78% 9.86% 8.65% 8.23% 8.64%
Tier 1 12.89 13.64 13.80 13.37 12.40 11.48 11.00 11.32
Total 16.31 17.16 17.51 17.49 16.75 15.86 15.65 15.98
Tier 1 leverage 7.37 7.84 7.84 7.79 7.53 7.11 6.86 7.25
Tangible equity (4) 7.62 7.85 7.73 7.48 7.54 7.16 6.63 6.85
Tangible common equity (4) 6.74 6.95 6.83 6.58 6.64 6.25 5.87 6.10
For footnotes see page 136.