Bank of America 2012 Annual Report Download - page 104
Download and view the complete annual report
Please find page 104 of the 2012 Bank of America annual report below. You can navigate through the pages in the report by either clicking on the pages listed below, or by using the keyword search tool below to find specific information within the annual report.-
 1
1 -
2
-
3
-
4
-
5
-
6
-
7
-
8
-
9
-
10
-
11
-
12
-
13
-
14
-
15
-
16
-
17
-
18
-
19
-
20
-
21
-
22
-
23
-
24
-
25
-
26
-
27
-
28
-
29
-
30
-
31
-
32
-
33
-
34
-
35
-
36
-
37
-
38
-
39
-
40
-
41
-
42
-
43
-
44
-
45
-
46
-
47
-
48
-
49
-
50
-
51
-
52
-
53
-
54
-
55
-
56
-
57
-
58
-
59
-
60
-
61
-
62
-
63
-
64
-
65
-
66
-
67
-
68
-
69
-
70
-
71
-
72
-
73
-
74
-
75
-
76
-
77
-
78
-
79
-
80
-
81
-
82
-
83
-
84
-
85
-
86
-
87
-
88
-
89
-
90
-
91
-
92
-
93
-
 94
94 -
 95
95 -
 96
96 -
 97
97 -
 98
98 -
 99
99 -
 100
100 -
 101
101 -
 102
102 -
 103
103 -
 104
104 -
 105
105 -
 106
106 -
 107
107 -
 108
108 -
 109
109 -
 110
110 -
 111
111 -
 112
112 -
 113
113 -
 114
114 -
115
-
116
-
117
-
118
-
119
-
120
-
121
-
122
-
123
-
124
-
125
-
126
-
127
-
128
-
129
-
130
-
131
-
132
-
133
-
134
-
135
-
136
-
137
-
138
-
139
-
140
-
141
-
142
-
143
-
144
-
145
-
146
-
147
-
148
-
149
-
150
-
151
-
152
-
153
-
154
-
155
-
156
-
157
-
158
-
159
-
160
-
161
-
162
-
163
-
164
-
165
-
166
-
167
-
168
-
169
-
170
-
171
-
172
-
173
-
174
-
175
-
176
-
177
-
178
-
179
-
180
-
181
-
182
-
183
-
184
-
185
-
186
-
187
-
188
-
189
-
190
-
191
-
192
-
193
-
194
-
195
-
196
-
197
-
198
-
199
-
200
-
201
-
202
-
203
-
204
-
205
-
206
-
207
-
208
-
209
-
210
-
211
-
212
-
213
-
214
-
215
-
216
-
217
-
218
-
219
-
220
-
221
-
222
-
223
-
224
-
225
-
226
-
227
-
228
-
229
-
230
-
231
-
232
-
233
-
234
-
235
-
236
-
237
-
238
-
239
-
240
-
241
-
242
-
243
-
244
-
245
-
246
-
247
-
248
-
249
-
250
-
251
-
252
-
253
-
254
-
255
-
256
-
257
-
258
-
259
-
260
-
261
-
262
-
263
-
264
-
265
-
266
-
267
-
268
-
269
-
270
-
271
-
272
-
273
-
274
-
275
-
276
-
277
-
278
-
279
-
280
-
281
-
282
-
283
-
284
 |
 |

102 Bank of America 2012
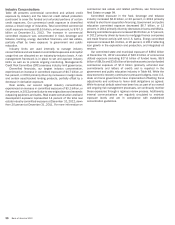
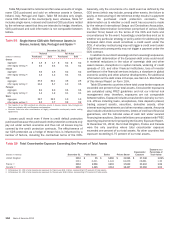
Our total non-U.S. exposure was $281.7 billion at
December 31, 2012, an increase of $44.6 billion from
December 31, 2011. The increase in non-U.S. exposure was driven
by our strategy to grow non-U.S. business in select countries and
diversify risk globally. Our non-U.S. exposure remained
concentrated in Europe which accounted for $137.8 billion, or 49
percent of total non-U.S. exposure. The European exposure was
mostly in Western Europe and was distributed across a variety of
industries. Select European countries are further detailed in Table
57. Asia Pacific was our second largest non-U.S. exposure at $92.4
billion, or 33 percent of total non-U.S. exposure. Latin America
accounted for $21.2 billion, or eight percent of total non-
U.S. exposure. Middle East and Africa accounted for $8.2 billion,
or three percent of total non-U.S. exposure. Other non-U.S.
exposure accounted for $22.0 billion or approximately seven
percent of total non-U.S. exposure. For information on country
specific exposures, see Tables 56 and 57.
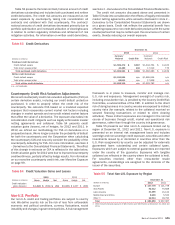
Funded loans and loan equivalents include loans, leases and
other extensions of credit or funds including letters of credit and
due from placements, which have not been reduced by collateral
or credit default protection. Funded loans are reported net of
charge-offs but prior to any allowance for loan and lease losses.
Unfunded commitments are the undrawn portion of legally binding
commitments related to loans and loan equivalents.
Net counterparty exposure includes the fair value of derivatives,
including the counterparty risk associated with credit default
swaps (CDS) and secured financing transactions. Derivative
exposures are reported net of collateral, which is predominantly
cash, pledged under legally enforceable netting agreements.
Secured financing transaction exposures have been reduced by
eligible cash or securities pledged as collateral. Counterparty
exposure has not been reduced by hedges or credit default
protection.
Securities and other investments are marked-to-market and
long positions are netted against short positions with the same
underlying issuer to, but not below, zero (i.e., negative issuer
exposures are reported as zero). Other investments includes our
GPI portfolio and strategic investments.
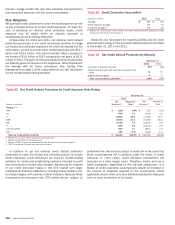
Net country exposure represents country exposure less hedges
and credit default protection purchased, net of credit default
protection sold. We hedge certain of our country exposures with
credit default protection primarily in the form of single-name, as
well as index and tranche CDS. The exposures associated with
these hedges represent the amount that would be realized upon
the isolated default of an individual issuer in the relevant country
assuming a zero recovery rate for that individual issuer, and are
calculated based on the CDS notional amount less any fair value
receivable or payable. Changes in the assumption of an isolated
default can produce different results in a particular tranche.
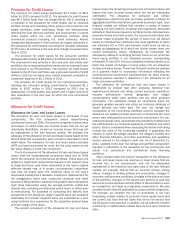
Table 56 presents our 20 largest, non-U.S. country exposures.
These exposures accounted for 89 percent of our total non-U.S.
exposure at December 31, 2012 compared to 88 percent at
December 31, 2011.
Table 56 Top 20 Non-U.S. Countries Exposure
(Dollars in millions)
Funded Loans
and Loan
Equivalents
Unfunded
Loan
Commitments
Net
Counterparty
Exposure
Securities/
Other
Investments
Country
Exposure at
December 31
2012
Hedges and
Credit Default
Protection
Net Country
Exposure at
December 31
2012
Increase
(Decrease) from
December 31
2011
United Kingdom $ 28,820 $ 10,593 $ 4,823 $ 6,082 $ 50,318 $ (3,126) $47,192 $ (613)
Japan 16,939 488 2,156 6,150 25,733 (1,894) 23,839 6,760
Canada 6,197 7,298 1,772 5,074 20,341 (1,365) 18,976 3,082
France 6,723 6,295 1,332 4,616 18,966 (2,675) 16,291 4,504
India 8,696 604 342 4,330 13,972 (254) 13,718 2,444
Brazil 8,251 494 517 3,617 12,879 (376) 12,503 4,548
Germany 4,407 5,392 3,008 3,334 16,141 (5,121) 11,020 6,020
Netherlands 6,177 2,257 614 2,850 11,898 (1,216) 10,682 6,054
Singapore 3,003 5,112 434 1,725 10,274 (100) 10,174 4,379
Australia 4,816 2,905 646 2,109 10,476 (747) 9,729 578
China 6,864 329 707 2,382 10,282 (1,095) 9,187 634
South Korea 4,766 691 319 2,618 8,394 (1,245) 7,149 (735)
Switzerland 2,476 3,199 509 605 6,789 (969) 5,820 1,450
Hong Kong 3,770 550 147 1,084 5,551 (108) 5,443 735
Russian Federation 3,187 1,398 87 678 5,350 (438) 4,912 3,297
Italy 2,858 2,825 2,295 521 8,499 (3,661) 4,838 (17)
Mexico 2,335 596 181 1,080 4,192 (533) 3,659 567
Taiwan 2,012 64 159 999 3,234 (12) 3,222 445
United Arab Emirates 2,134 412 186 116 2,848 (96) 2,752 1,217
Spain 1,899 1,018 192 604 3,713 (1,059) 2,654 117
Total top 20 non-U.S.
countries exposure $ 126,330 $ 52,520 $ 20,426 $ 50,574 $ 249,850 $ (26,090) $ 223,760 $ 45,466