Bank of America 2012 Annual Report Download - page 45
Download and view the complete annual report
Please find page 45 of the 2012 Bank of America annual report below. You can navigate through the pages in the report by either clicking on the pages listed below, or by using the keyword search tool below to find specific information within the annual report.-
 1
1 -
2
-
3
-
4
-
5
-
6
-
7
-
8
-
9
-
10
-
11
-
12
-
13
-
14
-
15
-
16
-
17
-
18
-
19
-
20
-
21
-
22
-
23
-
24
-
25
-
26
-
27
-
28
-
29
-
30
-
31
-
32
-
33
-
34
-
 35
35 -
 36
36 -
 37
37 -
 38
38 -
 39
39 -
 40
40 -
 41
41 -
 42
42 -
 43
43 -
 44
44 -
 45
45 -
 46
46 -
 47
47 -
 48
48 -
 49
49 -
 50
50 -
 51
51 -
 52
52 -
 53
53 -
 54
54 -
 55
55 -
56
-
57
-
58
-
59
-
60
-
61
-
62
-
63
-
64
-
65
-
66
-
67
-
68
-
69
-
70
-
71
-
72
-
73
-
74
-
75
-
76
-
77
-
78
-
79
-
80
-
81
-
82
-
83
-
84
-
85
-
86
-
87
-
88
-
89
-
90
-
91
-
92
-
93
-
94
-
95
-
96
-
97
-
98
-
99
-
100
-
101
-
102
-
103
-
104
-
105
-
106
-
107
-
108
-
109
-
110
-
111
-
112
-
113
-
114
-
115
-
116
-
117
-
118
-
119
-
120
-
121
-
122
-
123
-
124
-
125
-
126
-
127
-
128
-
129
-
130
-
131
-
132
-
133
-
134
-
135
-
136
-
137
-
138
-
139
-
140
-
141
-
142
-
143
-
144
-
145
-
146
-
147
-
148
-
149
-
150
-
151
-
152
-
153
-
154
-
155
-
156
-
157
-
158
-
159
-
160
-
161
-
162
-
163
-
164
-
165
-
166
-
167
-
168
-
169
-
170
-
171
-
172
-
173
-
174
-
175
-
176
-
177
-
178
-
179
-
180
-
181
-
182
-
183
-
184
-
185
-
186
-
187
-
188
-
189
-
190
-
191
-
192
-
193
-
194
-
195
-
196
-
197
-
198
-
199
-
200
-
201
-
202
-
203
-
204
-
205
-
206
-
207
-
208
-
209
-
210
-
211
-
212
-
213
-
214
-
215
-
216
-
217
-
218
-
219
-
220
-
221
-
222
-
223
-
224
-
225
-
226
-
227
-
228
-
229
-
230
-
231
-
232
-
233
-
234
-
235
-
236
-
237
-
238
-
239
-
240
-
241
-
242
-
243
-
244
-
245
-
246
-
247
-
248
-
249
-
250
-
251
-
252
-
253
-
254
-
255
-
256
-
257
-
258
-
259
-
260
-
261
-
262
-
263
-
264
-
265
-
266
-
267
-
268
-
269
-
270
-
271
-
272
-
273
-
274
-
275
-
276
-
277
-
278
-
279
-
280
-
281
-
282
-
283
-
284
 |
 |

Bank of America 2012 43
criticized balances and NPAs. For more information regarding
economic capital, see Supplemental Financial Data on page 31.
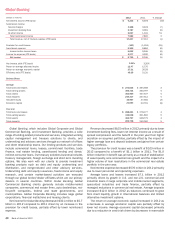
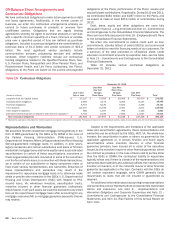
Global Corporate and Global Commercial Banking
Global Corporate and Global Commercial Banking includes Global
Treasury Services and Business Lending activities. Global Treasury
Services includes deposits, treasury management, credit card,
foreign exchange, short-term investment and custody solutions to
corporate and commercial banking clients. Business Lending
includes various loan-related products and services including
commercial loans, leases, commitment facilities, trade finance,
real estate lending, asset-based lending and direct/indirect
consumer loans. The table below presents a summary of Global
Corporate and Global Commercial Banking results.
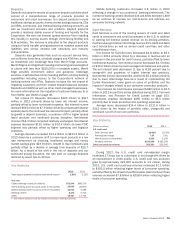
Global Corporate and Global Commercial Banking
Global Corporate Banking Global Commercial Banking Total
(Dollars in millions) 2012 2011 2012 2011 2012 2011
Revenue
Business Lending $ 3,202 $ 3,240 $ 4,585 $ 4,996 $ 7,787 $ 8,236
Global Treasury Services 2,629 2,507 3,561 3,489 6,190 5,996
Total revenue, net of interest expense $ 5,831 $ 5,747 $ 8,146 $ 8,485 $13,977 $ 14,232
Average
Total loans and leases $ 110,109 $101,956 $ 161,951 $162,526 $ 272,060 $ 264,482
Total deposits 114,185 108,749 135,096 128,513 249,281 237,262
Year end
Total loans and leases $ 116,234 $113,978 $ 172,018 $163,256 $ 288,252 $ 277,234
Total deposits 131,181 110,898 138,517 135,423 269,698 246,321
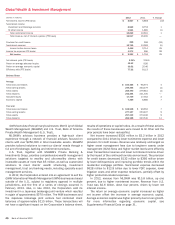
Global Corporate and Global Commercial Banking revenue
decreased $255 million to $14.0 billion in 2012 compared to
2011 primarily due to lower revenue in Business Lending that was
partially offset by an increase in Global Treasury Services revenue.
Global Treasury Services revenue increased $122 million in
Global Corporate Banking and $72 million in Global Commercial
Banking in 2012 as growth in U.S. and non-U.S. deposit balances
and higher service charges offset the impact of the low rate
environment.
Business Lending revenue in Global Corporate Banking
remained relatively unchanged in 2012 compared to 2011 as lower
net interest income impacted by the low rate environment and
lower accretion on acquired portfolios was offset by growth in the
loan portfolio and gains on fair value option loans. Business
Lending revenue decreased $411 million in Global Commercial
Banking as managed reductions of commercial real estate
criticized assets, run-off of a liquidating auto loan portfolio and
lower accretion on acquired portfolios were partially offset by
increases in the commercial and industrial loan portfolio.
Average loans and leases in Global Corporate and Global
Commercial Banking increased three percent in 2012 driven by
growth in U.S. and non-U.S. commercial and industrial loans from
greater client demand, partially offset by managed reductions of
commercial real estate criticized assets and run-off of a liquidating
auto loan portfolio. Average deposits in Global Corporate and
Global Commercial Banking increased five percent in 2012
compared to 2011 as balances continued to grow due to client
liquidity, international growth and limited alternative investment
options.
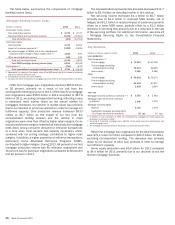
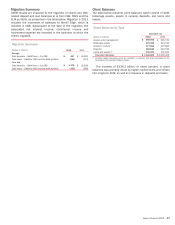
Investment Banking
Client teams and product specialists underwrite and distribute
debt, equity and other loan products, and provide advisory services
and tailored risk management solutions. The economics of certain
investment banking and underwriting activities are shared primarily
between Global Banking and Global Markets based on the
contribution by and involvement of each segment. To provide a
complete discussion of our consolidated investment banking fees,
the table below presents total Corporation investment banking
fees as well as the portion attributable to Global Banking.
Investment Banking Fees
Global Banking Total Corporation
(Dollars in millions) 2012 2011 2012 2011
Products
Advisory $ 995 $ 1,183 $ 1,066 $ 1,248
Debt issuance 1,385 1,287 3,362 2,878
Equity issuance 407 591 1,026 1,459
Gross investment banking
fees $ 2,787 $ 3,061 $ 5,454 $ 5,585
Self-led (42) (164) (155) (368)
Total investment banking
fees $ 2,745 $ 2,897 $ 5,299 $ 5,217
Total Corporation investment banking fees, excluding self-led
deals remained relatively unchanged in 2012 compared to 2011
as higher debt issuance fees partially offset lower equity issuance
and advisory fees.