Bank of America 2012 Annual Report Download - page 85
Download and view the complete annual report
Please find page 85 of the 2012 Bank of America annual report below. You can navigate through the pages in the report by either clicking on the pages listed below, or by using the keyword search tool below to find specific information within the annual report.-
 1
1 -
2
-
3
-
4
-
5
-
6
-
7
-
8
-
9
-
10
-
11
-
12
-
13
-
14
-
15
-
16
-
17
-
18
-
19
-
20
-
21
-
22
-
23
-
24
-
25
-
26
-
27
-
28
-
29
-
30
-
31
-
32
-
33
-
34
-
35
-
36
-
37
-
38
-
39
-
40
-
41
-
42
-
43
-
44
-
45
-
46
-
47
-
48
-
49
-
50
-
51
-
52
-
53
-
54
-
55
-
56
-
57
-
58
-
59
-
60
-
61
-
62
-
63
-
64
-
65
-
66
-
67
-
68
-
69
-
70
-
71
-
72
-
73
-
74
-
 75
75 -
 76
76 -
 77
77 -
 78
78 -
 79
79 -
 80
80 -
 81
81 -
 82
82 -
 83
83 -
 84
84 -
 85
85 -
 86
86 -
 87
87 -
 88
88 -
 89
89 -
 90
90 -
 91
91 -
 92
92 -
 93
93 -
 94
94 -
 95
95 -
96
-
97
-
98
-
99
-
100
-
101
-
102
-
103
-
104
-
105
-
106
-
107
-
108
-
109
-
110
-
111
-
112
-
113
-
114
-
115
-
116
-
117
-
118
-
119
-
120
-
121
-
122
-
123
-
124
-
125
-
126
-
127
-
128
-
129
-
130
-
131
-
132
-
133
-
134
-
135
-
136
-
137
-
138
-
139
-
140
-
141
-
142
-
143
-
144
-
145
-
146
-
147
-
148
-
149
-
150
-
151
-
152
-
153
-
154
-
155
-
156
-
157
-
158
-
159
-
160
-
161
-
162
-
163
-
164
-
165
-
166
-
167
-
168
-
169
-
170
-
171
-
172
-
173
-
174
-
175
-
176
-
177
-
178
-
179
-
180
-
181
-
182
-
183
-
184
-
185
-
186
-
187
-
188
-
189
-
190
-
191
-
192
-
193
-
194
-
195
-
196
-
197
-
198
-
199
-
200
-
201
-
202
-
203
-
204
-
205
-
206
-
207
-
208
-
209
-
210
-
211
-
212
-
213
-
214
-
215
-
216
-
217
-
218
-
219
-
220
-
221
-
222
-
223
-
224
-
225
-
226
-
227
-
228
-
229
-
230
-
231
-
232
-
233
-
234
-
235
-
236
-
237
-
238
-
239
-
240
-
241
-
242
-
243
-
244
-
245
-
246
-
247
-
248
-
249
-
250
-
251
-
252
-
253
-
254
-
255
-
256
-
257
-
258
-
259
-
260
-
261
-
262
-
263
-
264
-
265
-
266
-
267
-
268
-
269
-
270
-
271
-
272
-
273
-
274
-
275
-
276
-
277
-
278
-
279
-
280
-
281
-
282
-
283
-
284
 |
 |

Bank of America 2012 83
total nonperforming residential mortgage loans. Net charge-offs
related to the CRA portfolio were $643 million and $732 million
for 2012 and 2011, or 21 percent and 19 percent of total net
charge-offs for the residential mortgage portfolio.
For information on representations and warranties related to
our residential mortgage portfolio, see Off-Balance Sheet
Arrangements and Contractual Obligations – Representations and
Warranties on page 50 and Note 8 – Representations and
Warranties Obligations and Corporate Guarantees to the
Consolidated Financial Statements.
Home Equity
The home equity portfolio makes up 20 percent of the consumer
portfolio and is comprised of HELOCs, home equity loans and
reverse mortgages. As of December 31, 2012, our HELOC portfolio
had an outstanding balance of $91.3 billion, or 85 percent of the
total home equity portfolio. HELOCs generally have an initial draw
period of 10 years with approximately nine percent of the portfolio
having a draw period of five years with a five-year renewal option.
During the initial draw period, the borrowers are only required to
pay the interest due on the loans on a monthly basis. After the
initial draw period ends, the loans generally convert to 15-year
amortizing loans.
As of December 31, 2012, our home equity loan portfolio had
an outstanding balance of $15.3 billion, or 14 percent of the total
home equity portfolio. Home equity loans are almost all fixed-rate
loans with amortizing payment terms of 10 to 30 years and 51
percent of these loans have 25 to 30-year terms.
As of December 31, 2012, our reverse mortgage portfolio had
an outstanding balance of $1.4 billion, or one percent of the total
home equity portfolio. In 2011, we exited the reverse mortgage
origination business.
At December 31, 2012, 88 percent of the home equity portfolio
was included in CRES while the remainder of the portfolio was
primarily in GWIM. Outstanding balances in the home equity
portfolio decreased $16.7 billion in 2012 primarily due to
paydowns and charge-offs outpacing new originations and draws
on existing lines. In addition, in 2012, $2.9 billion of loans,
including $2.5 billion of Countrywide PCI loans in the home equity
portfolio, were forgiven in connection with the National Mortgage
Settlement. Of the total home equity portfolio at December 31,
2012 and 2011, $21.1 billion, or 20 percent, and $24.5 billion,
or 20 percent, were in first-lien positions (21 percent and
22 percent excluding the Countrywide PCI home equity portfolio
at December 31, 2012 and 2011). As of December 31, 2012,
outstanding balances in the home equity portfolio that were in a
second-lien or more junior-lien position and where we also held
the first-lien loan totaled $29.8 billion, or 30 percent of our total
home equity portfolio excluding the Countrywide PCI loan portfolio.
Unused HELOCs totaled $60.9 billion at December 31, 2012
compared to $67.5 billion at December 31, 2011. This decrease
was primarily due to customers choosing to close accounts as
well as line management initiatives on deteriorating accounts,
which more than offset new production. The HELOC utilization rate
was 60 percent at December 31, 2012 compared to 61 percent
at December 31, 2011.
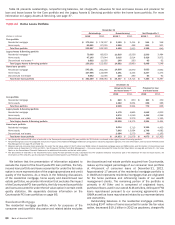
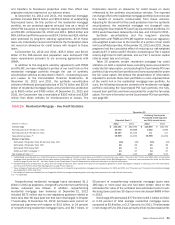
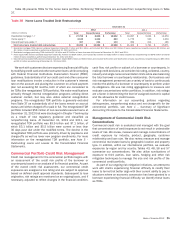
Table 27 presents certain home equity portfolio key credit
statistics on both a reported basis as well as excluding the
Countrywide PCI loan portfolio. We believe the presentation of
information adjusted to exclude the impact of the Countrywide PCI
loan portfolio is more representative of the credit risk in this
portfolio.
Table 27 Home Equity – Key Credit Statistics
December 31
Reported Basis
Excluding Countrywide
Purchased
Credit-impaired Loans
(Dollars in millions) 2012 2011 2012 2011
Outstandings $ 107,996 $ 124,699 $99,449 $ 112,721
Accruing past due 30 days or more (1) 1,098 1,658 1,098 1,658
Nonperforming loans (1, 2) 4,281 2,453 4,281 2,453
Percent of portfolio
Refreshed combined LTV greater than 90 but less than 100 10% 10% 10%11%
Refreshed combined LTV greater than 100 31 36 29 32
Refreshed FICO below 620 (3) 911 89
2006 and 2007 vintages (4) 48 50 46 46
Net charge-off ratio (2, 5) 3.62 3.42 3.98 3.77
(1) Accruing past due 30 days or more includes $321 million and $609 million and nonperforming loans includes $824 million and $703 million of loans where we serviced the underlying first-lien at
December 31, 2012 and 2011.
(2) Nonperforming loans at December 31, 2012 and net charge-off ratios for 2012 include the impacts of the National Mortgage Settlement and guidance issued by regulatory agencies. For more
information, see Consumer Portfolio Credit Risk Management on page 76 and Table 21.
(3) Beginning in 2012, home equity FICO metrics reflected an updated scoring model that is more representative of the credit risk of our borrowers. Prior period amounts were adjusted to reflect these
updates.
(4) These vintages of loans have higher refreshed combined LTV ratios and accounted for 51 percent and 54 percent of nonperforming home equity loans at December 31, 2012 and 2011, and accounted
for 60 percent and 65 percent of net charge-offs in 2012 and 2011.
(5) Net charge-off ratios are calculated as net charge-offs divided by average outstanding loans.
The following discussion presents the home equity portfolio
excluding the Countrywide PCI loan portfolio.
Nonperforming outstanding balances in the home equity
portfolio increased $1.8 billion in 2012 due to the reclassification
to nonperforming of junior-lien loans less than 90 days past due
that have a senior-lien loan that is 90 days or more past due which
resulted in a $1.5 billion increase as of December 31, 2012, and
the reclassification to nonperforming of loans less than 60 days
past due that were discharged in Chapter 7 bankruptcy which
resulted in an increase of $478 million at December 31, 2012, in
both cases pursuant to new regulatory guidance.