Bank of America 2012 Annual Report Download - page 208
Download and view the complete annual report
Please find page 208 of the 2012 Bank of America annual report below. You can navigate through the pages in the report by either clicking on the pages listed below, or by using the keyword search tool below to find specific information within the annual report.-
 1
1 -
2
-
3
-
4
-
5
-
6
-
7
-
8
-
9
-
10
-
11
-
12
-
13
-
14
-
15
-
16
-
17
-
18
-
19
-
20
-
21
-
22
-
23
-
24
-
25
-
26
-
27
-
28
-
29
-
30
-
31
-
32
-
33
-
34
-
35
-
36
-
37
-
38
-
39
-
40
-
41
-
42
-
43
-
44
-
45
-
46
-
47
-
48
-
49
-
50
-
51
-
52
-
53
-
54
-
55
-
56
-
57
-
58
-
59
-
60
-
61
-
62
-
63
-
64
-
65
-
66
-
67
-
68
-
69
-
70
-
71
-
72
-
73
-
74
-
75
-
76
-
77
-
78
-
79
-
80
-
81
-
82
-
83
-
84
-
85
-
86
-
87
-
88
-
89
-
90
-
91
-
92
-
93
-
94
-
95
-
96
-
97
-
98
-
99
-
100
-
101
-
102
-
103
-
104
-
105
-
106
-
107
-
108
-
109
-
110
-
111
-
112
-
113
-
114
-
115
-
116
-
117
-
118
-
119
-
120
-
121
-
122
-
123
-
124
-
125
-
126
-
127
-
128
-
129
-
130
-
131
-
132
-
133
-
134
-
135
-
136
-
137
-
138
-
139
-
140
-
141
-
142
-
143
-
144
-
145
-
146
-
147
-
148
-
149
-
150
-
151
-
152
-
153
-
154
-
155
-
156
-
157
-
158
-
159
-
160
-
161
-
162
-
163
-
164
-
165
-
166
-
167
-
168
-
169
-
170
-
171
-
172
-
173
-
174
-
175
-
176
-
177
-
178
-
179
-
180
-
181
-
182
-
183
-
184
-
185
-
186
-
187
-
188
-
189
-
190
-
191
-
192
-
193
-
194
-
195
-
196
-
197
-
 198
198 -
 199
199 -
 200
200 -
 201
201 -
 202
202 -
 203
203 -
 204
204 -
 205
205 -
 206
206 -
 207
207 -
 208
208 -
 209
209 -
 210
210 -
 211
211 -
 212
212 -
 213
213 -
 214
214 -
 215
215 -
 216
216 -
 217
217 -
 218
218 -
219
-
220
-
221
-
222
-
223
-
224
-
225
-
226
-
227
-
228
-
229
-
230
-
231
-
232
-
233
-
234
-
235
-
236
-
237
-
238
-
239
-
240
-
241
-
242
-
243
-
244
-
245
-
246
-
247
-
248
-
249
-
250
-
251
-
252
-
253
-
254
-
255
-
256
-
257
-
258
-
259
-
260
-
261
-
262
-
263
-
264
-
265
-
266
-
267
-
268
-
269
-
270
-
271
-
272
-
273
-
274
-
275
-
276
-
277
-
278
-
279
-
280
-
281
-
282
-
283
-
284
 |
 |

206 Bank of America 2012
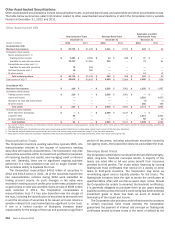
compared to total assets of the CDO vehicle. Liquidity exposure
included in the table is reported net of previously recorded losses.
Customer Vehicles
Customer vehicles include credit-linked and equity-linked note
vehicles, repackaging vehicles and asset acquisition vehicles,
which are typically created on behalf of customers who wish to
obtain market or credit exposure to a specific company or financial
instrument.
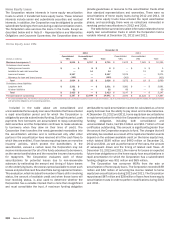
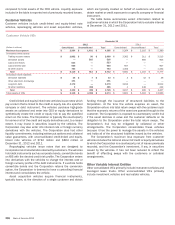
The table below summarizes select information related to
customer vehicles in which the Corporation held a variable interest
at December 31, 2012 and 2011.
Customer Vehicle VIEs
December 31
2012 2011
(Dollars in millions) Consolidated Unconsolidated Total Consolidated Unconsolidated Total
Maximum loss exposure $ 2,994 $ 1,401 $ 4,395 $ 3,264 $ 2,116 $ 5,380
On-balance sheet assets
Trading account assets $ 2,882 $ 98 $ 2,980 $ 3,302 $ 211 $ 3,513
Derivative assets — 516 516 — 905 905
Loans and leases 523 — 523 ———
Loans held-for-sale 950 — 950 907 — 907
All other assets 763 — 763 1,452 — 1,452
Total $ 5,118 $ 614 $ 5,732 $ 5,661 $ 1,116 $ 6,777
On-balance sheet liabilities
Derivative liabilities $ 26 $ 7$ 33 $4$ 42 $ 46
Other short-term borrowings 131 — 131 ———
Long-term debt 3,179 — 3,179 3,912 — 3,912
All other liabilities 3 382 385 1 448 449
Total $ 3,339 $ 389 $ 3,728 $ 3,917 $ 490 $ 4,407
Total assets of VIEs $ 5,118 $ 4,055 $ 9,173 $ 5,661 $ 5,302 $ 10,963
Credit-linked and equity-linked note vehicles issue notes which
pay a return that is linked to the credit or equity risk of a specified
company or debt instrument. The vehicles purchase high-grade
assets as collateral and enter into CDS or equity derivatives to
synthetically create the credit or equity risk to pay the specified
return on the notes. The Corporation is typically the counterparty
for some or all of the credit and equity derivatives and, to a lesser
extent, it may invest in securities issued by the vehicles. The
Corporation may also enter into interest rate or foreign currency
derivatives with the vehicles. The Corporation also had other
liquidity commitments, including written put options and collateral
value guarantees, with unconsolidated credit-linked and equity-
linked note vehicles of $742 million and $824 million at
December 31, 2012 and 2011.
Repackaging vehicles issue notes that are designed to
incorporate risk characteristics desired by customers. The vehicles
hold debt instruments such as corporate bonds, convertible bonds
or ABS with the desired credit risk profile. The Corporation enters
into derivatives with the vehicles to change the interest rate or
foreign currency profile of the debt instruments. If a vehicle holds
convertible bonds and the Corporation retains the conversion
option, the Corporation is deemed to have a controlling financial
interest and consolidates the vehicle.
Asset acquisition vehicles acquire financial instruments,
typically loans, at the direction of a single customer and obtain
funding through the issuance of structured liabilities to the
Corporation. At the time the vehicle acquires an asset, the
Corporation enters into total return swaps with the customer such
that the economic returns of the asset are passed through to the
customer. The Corporation is exposed to counterparty credit risk
if the asset declines in value and the customer defaults on its
obligation to the Corporation under the total return swaps. The
Corporation’s risk may be mitigated by collateral or other
arrangements. The Corporation consolidates these vehicles
because it has the power to manage the assets in the vehicles
and holds all of the structured liabilities issued by the vehicles.
The Corporation’s maximum loss exposure from customer
vehicles includes the notional amount of credit or equity derivatives
to which the Corporation is a counterparty, net of losses previously
recorded, and the Corporation’s investment, if any, in securities
issued by the vehicles. It has not been reduced to reflect the
benefit of offsetting swaps with the customers or collateral
arrangements.
Other Variable Interest Entities
Other consolidated VIEs primarily include investment vehicles and
leveraged lease trusts. Other unconsolidated VIEs primarily
include investment vehicles and real estate vehicles.