Bank of America 2012 Annual Report Download - page 56
Download and view the complete annual report
Please find page 56 of the 2012 Bank of America annual report below. You can navigate through the pages in the report by either clicking on the pages listed below, or by using the keyword search tool below to find specific information within the annual report.-
 1
1 -
2
-
3
-
4
-
5
-
6
-
7
-
8
-
9
-
10
-
11
-
12
-
13
-
14
-
15
-
16
-
17
-
18
-
19
-
20
-
21
-
22
-
23
-
24
-
25
-
26
-
27
-
28
-
29
-
30
-
31
-
32
-
33
-
34
-
35
-
36
-
37
-
38
-
39
-
40
-
41
-
42
-
43
-
44
-
45
-
 46
46 -
 47
47 -
 48
48 -
 49
49 -
 50
50 -
 51
51 -
 52
52 -
 53
53 -
 54
54 -
 55
55 -
 56
56 -
 57
57 -
 58
58 -
 59
59 -
 60
60 -
 61
61 -
 62
62 -
 63
63 -
 64
64 -
 65
65 -
 66
66 -
67
-
68
-
69
-
70
-
71
-
72
-
73
-
74
-
75
-
76
-
77
-
78
-
79
-
80
-
81
-
82
-
83
-
84
-
85
-
86
-
87
-
88
-
89
-
90
-
91
-
92
-
93
-
94
-
95
-
96
-
97
-
98
-
99
-
100
-
101
-
102
-
103
-
104
-
105
-
106
-
107
-
108
-
109
-
110
-
111
-
112
-
113
-
114
-
115
-
116
-
117
-
118
-
119
-
120
-
121
-
122
-
123
-
124
-
125
-
126
-
127
-
128
-
129
-
130
-
131
-
132
-
133
-
134
-
135
-
136
-
137
-
138
-
139
-
140
-
141
-
142
-
143
-
144
-
145
-
146
-
147
-
148
-
149
-
150
-
151
-
152
-
153
-
154
-
155
-
156
-
157
-
158
-
159
-
160
-
161
-
162
-
163
-
164
-
165
-
166
-
167
-
168
-
169
-
170
-
171
-
172
-
173
-
174
-
175
-
176
-
177
-
178
-
179
-
180
-
181
-
182
-
183
-
184
-
185
-
186
-
187
-
188
-
189
-
190
-
191
-
192
-
193
-
194
-
195
-
196
-
197
-
198
-
199
-
200
-
201
-
202
-
203
-
204
-
205
-
206
-
207
-
208
-
209
-
210
-
211
-
212
-
213
-
214
-
215
-
216
-
217
-
218
-
219
-
220
-
221
-
222
-
223
-
224
-
225
-
226
-
227
-
228
-
229
-
230
-
231
-
232
-
233
-
234
-
235
-
236
-
237
-
238
-
239
-
240
-
241
-
242
-
243
-
244
-
245
-
246
-
247
-
248
-
249
-
250
-
251
-
252
-
253
-
254
-
255
-
256
-
257
-
258
-
259
-
260
-
261
-
262
-
263
-
264
-
265
-
266
-
267
-
268
-
269
-
270
-
271
-
272
-
273
-
274
-
275
-
276
-
277
-
278
-
279
-
280
-
281
-
282
-
283
-
284
 |
 |
54 Bank of America 2012
loss for litigation and regulatory matters disclosed in Note 13 –
Commitments and Contingencies to the Consolidated Financial
Statements; however, such loss could be material.
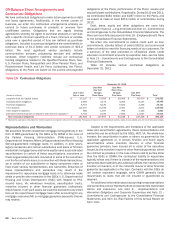
At December 31, 2012 and 2011, the liability for
representations and warranties and corporate guarantees was
$19.0 billion and $15.9 billion. For 2012, the provision for
representations and warranties and corporate guarantees was
$3.9 billion compared to $15.6 billion for 2011. The provision in
2012 included $2.5 billion in provision related to the FNMA
Settlement and $500 million for obligations to FNMA related to
MI rescissions. The provision in 2011 included $8.6 billion in
provision and other expenses related to the BNY Mellon Settlement
to resolve nearly all of the legacy Countrywide-issued first-lien non-
GSE repurchase exposures, and $7.0 billion in provision related
to other non-GSE, and to a lesser extent, GSE exposures.
Estimated Range of Possible Loss
Our estimated liability at December 31, 2012 for obligations under
representations and warranties is necessarily dependent on, and
limited by, a number of factors, including for private-label
securitizations, the implied repurchase experience based on the
BNY Mellon Settlement, as well as certain other assumptions and
judgmental factors. Accordingly, future provisions associated with
obligations under representations and warranties may be
materially impacted if actual experiences are different from
historical experience or our understandings, interpretations or
assumptions.
In the case of non-GSE exposures, including private-label
securitizations, our estimate of the representations and warranties
liability and the corresponding range of possible loss considers,
among other things, repurchase experience based on the BNY
Mellon Settlement, adjusted to reflect differences between the
Covered Trusts and the remainder of the population of private-label
securitizations, and assumes that the conditions to the BNY Mellon
Settlement will be met. Where relevant, we also take into account
more recent experience, such as increased claims and other facts
and circumstances, such as bulk settlements, as we believe
appropriate.
The representations and warranties liability represents our
best estimate of probable incurred losses as of December 31,
2012. However, it is reasonably possible that future
representations and warranties losses may occur in excess of the
amounts recorded for these exposures. In addition, we have not
recorded any representations and warranties liability for certain
potential private-label securitization and whole-loan exposures
where we have little to no claim experience. We currently estimate
that the range of possible loss for representations and warranties
exposures could be up to $4 billion over accruals at December 31,
2012 compared to up to $5 billion over accruals at December 31,
2011 for only non-GSE representations and warranties exposures.
The range of possible loss at December 31, 2012 reflects the
impact of the FNMA Settlement and, as a result, addresses
principally non-GSE exposures. The reduction in the range of
possible loss from December 31, 2011 is the net impact of, among
other changes, updated assumptions and other developments.
The estimated range of possible loss related to these
representations and warranties exposures does not represent a
probable loss, and is based on currently available information,
significant judgment and a number of assumptions that are subject
to change. For additional information about the methodology used
to estimate the representations and warranties liability and the
corresponding range of possible loss, see Note 8 –
Representations and Warranties Obligations and Corporate
Guarantees to the Consolidated Financial Statements.
Future provisions and/or ranges of possible loss for
representations and warranties may be significantly impacted if
actual experiences are different from our assumptions in our
predictive models, including, without limitation, ultimate resolution
of the BNY Mellon Settlement, estimated repurchase rates,
economic conditions, estimated home prices, consumer and
counterparty behavior, and a variety of other judgmental factors.
Adverse developments with respect to one or more of the
assumptions underlying the liability for representations and
warranties and the corresponding estimated range of possible loss
could result in significant increases to future provisions and/or
the estimated range of possible loss. For example, if courts, in
the context of claims brought by private-label securitization
trustees, were to disagree with our interpretation that the
underlying agreements require a claimant to prove that the
representations and warranties breach was the cause of the loss,
it could significantly impact the estimated range of possible loss.
Additionally, if recent court rulings related to monoline litigation,
including one related to us, that have allowed sampling of loan
files instead of requiring a loan-by-loan review to determine if a
representations and warranties breach has occurred, are followed
generally by the courts in future monoline litigation, private-label
securitization counterparties may view litigation as a more
attractive alternative compared to a loan-by-loan review. For
additional information regarding these issues, see MBIA litigation
in Litigation and Regulatory Matters in Note 13 – Commitments
and Contingencies to the Consolidated Financial Statements.
Finally, although we believe that the representations and
warranties typically given in non-GSE transactions are less rigorous
and actionable than those given in GSE transactions, we do not
have significant experience resolving loan-level claims in non-GSE
transactions to measure the impact of these differences on the
probability that a loan will be required to be repurchased.
Government-sponsored Enterprises Experience
Prior to the FNMA Settlement, our repurchase claims experience
with the GSEs had been concentrated in the 2004 through 2008
vintages where we believed that our exposure to representations
and warranties liability was most significant. Our repurchase
claims experience related to loans originated prior to 2004 has
not been significant and we believe that changes made to our
operations and underwriting policies reduced our exposure related
to loans originated after 2008.
Bank of America and legacy Countrywide sold approximately
$1.1 trillion of loans originated from 2004 through 2008 to the
GSEs. As of December 31, 2012, 12 percent of the original funded
balance of loans in these vintages had defaulted or were 180 days
or more past due (severely delinquent). As of December 31, 2012,
we had received $43.5 billion in repurchase claims associated
with these vintages, representing approximately four percent of
the original funded balance of loans sold to the GSEs in these
vintages. Prior to the FNMA Settlement, we had resolved $29.6
billion of these claims with a net loss experience of approximately
29 percent, after considering the effect of collateral. Our collateral
loss severity rate on approved repurchases had averaged
approximately 55 percent. The FNMA Settlement in January 2013
resolved an additional $12.2 billion in repurchase claims
outstanding at December 31, 2012, primarily related to loans
originated from 2004 through 2008.