Bank of America 2012 Annual Report Download - page 35
Download and view the complete annual report
Please find page 35 of the 2012 Bank of America annual report below. You can navigate through the pages in the report by either clicking on the pages listed below, or by using the keyword search tool below to find specific information within the annual report.-
 1
1 -
2
-
3
-
4
-
5
-
6
-
7
-
8
-
9
-
10
-
11
-
12
-
13
-
14
-
15
-
16
-
17
-
18
-
19
-
20
-
21
-
22
-
23
-
24
-
 25
25 -
 26
26 -
 27
27 -
 28
28 -
 29
29 -
 30
30 -
 31
31 -
 32
32 -
 33
33 -
 34
34 -
 35
35 -
 36
36 -
 37
37 -
 38
38 -
 39
39 -
 40
40 -
 41
41 -
 42
42 -
 43
43 -
 44
44 -
 45
45 -
46
-
47
-
48
-
49
-
50
-
51
-
52
-
53
-
54
-
55
-
56
-
57
-
58
-
59
-
60
-
61
-
62
-
63
-
64
-
65
-
66
-
67
-
68
-
69
-
70
-
71
-
72
-
73
-
74
-
75
-
76
-
77
-
78
-
79
-
80
-
81
-
82
-
83
-
84
-
85
-
86
-
87
-
88
-
89
-
90
-
91
-
92
-
93
-
94
-
95
-
96
-
97
-
98
-
99
-
100
-
101
-
102
-
103
-
104
-
105
-
106
-
107
-
108
-
109
-
110
-
111
-
112
-
113
-
114
-
115
-
116
-
117
-
118
-
119
-
120
-
121
-
122
-
123
-
124
-
125
-
126
-
127
-
128
-
129
-
130
-
131
-
132
-
133
-
134
-
135
-
136
-
137
-
138
-
139
-
140
-
141
-
142
-
143
-
144
-
145
-
146
-
147
-
148
-
149
-
150
-
151
-
152
-
153
-
154
-
155
-
156
-
157
-
158
-
159
-
160
-
161
-
162
-
163
-
164
-
165
-
166
-
167
-
168
-
169
-
170
-
171
-
172
-
173
-
174
-
175
-
176
-
177
-
178
-
179
-
180
-
181
-
182
-
183
-
184
-
185
-
186
-
187
-
188
-
189
-
190
-
191
-
192
-
193
-
194
-
195
-
196
-
197
-
198
-
199
-
200
-
201
-
202
-
203
-
204
-
205
-
206
-
207
-
208
-
209
-
210
-
211
-
212
-
213
-
214
-
215
-
216
-
217
-
218
-
219
-
220
-
221
-
222
-
223
-
224
-
225
-
226
-
227
-
228
-
229
-
230
-
231
-
232
-
233
-
234
-
235
-
236
-
237
-
238
-
239
-
240
-
241
-
242
-
243
-
244
-
245
-
246
-
247
-
248
-
249
-
250
-
251
-
252
-
253
-
254
-
255
-
256
-
257
-
258
-
259
-
260
-
261
-
262
-
263
-
264
-
265
-
266
-
267
-
268
-
269
-
270
-
271
-
272
-
273
-
274
-
275
-
276
-
277
-
278
-
279
-
280
-
281
-
282
-
283
-
284
 |
 |
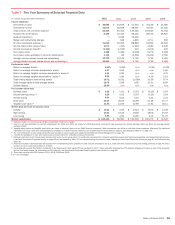
Bank of America 2012 33
Business Segment Operations
Segment Description and Basis of Presentation
We report the results of our operations through five business
segments: CBB, CRES, Global Banking, Global Markets and GWIM,
with the remaining operations recorded in All Other.
We prepare and evaluate segment results using certain non-
GAAP financial measures. For additional information, see
Supplemental Financial Data on page 31.
The management accounting and reporting process derives
segment and business results by utilizing allocation
methodologies for revenue and expense. The net income derived
for the businesses is dependent upon revenue and cost allocations
using an activity-based costing model, funds transfer pricing, and
other methodologies and assumptions management believes are
appropriate to reflect the results of the business.
Total revenue, net of interest expense, includes net interest
income on a FTE basis and noninterest income. The adjustment
of net interest income to a FTE basis results in a corresponding
increase in income tax expense. The segment results also reflect
certain revenue and expense methodologies that are utilized to
determine net income. The net interest income of the businesses
includes the results of a funds transfer pricing process that
matches assets and liabilities with similar interest rate sensitivity
and maturity characteristics. For presentation purposes, in
segments where the total of liabilities and equity exceeds assets,
which are generally deposit-taking segments, we allocate assets
to match liabilities. Net interest income of the business segments
also includes an allocation of net interest income generated by
certain of our ALM activities.
Our ALM activities include an overall interest rate risk
management strategy that incorporates the use of various
derivatives and cash instruments to manage fluctuations in
earnings and capital that are caused by interest rate volatility. Our
goal is to manage interest rate sensitivity so that movements in
interest rates do not significantly adversely affect earnings and
capital. The majority of our ALM activities are allocated to the
business segments and fluctuate based on performance. ALM
activities include external product pricing decisions including
deposit pricing strategies, the effects of our internal funds transfer
pricing process and the net effects of other ALM activities.
Certain expenses not directly attributable to a specific business
segment are allocated to the segments. The most significant of
these expenses include data and item processing costs and
certain centralized or shared functions. Data processing costs are
allocated to the segments based on equipment usage. Item
processing costs are allocated to the segments based on the
volume of items processed for each segment. The costs of certain
other centralized or shared functions are allocated based on
methodologies that reflect utilization.
We allocate economic capital to the business segments and
related businesses using a risk-adjusted methodology
incorporating each segment’s credit, market, interest rate,
strategic and operational risk components. See Managing Risk on
page 62 and Strategic Risk Management on page 66 for more
information on the nature of these risks. A business segment’s
allocated equity includes this economic capital allocation and also
includes the portion of goodwill and intangibles specifically
assigned to the business segment. We benefit from the
diversification of risk across these components which is reflected
as a reduction to allocated equity for each segment. The risk-
adjusted methodology is periodically refined and such refinements
are reflected as changes to allocated equity in each segment.
For more information on the business segments and
reconciliations to consolidated total revenue, net income (loss)
and year-end total assets, see Note 26 – Business Segment
Information to the Consolidated Financial Statements.