Bank of America 2012 Annual Report Download - page 225
Download and view the complete annual report
Please find page 225 of the 2012 Bank of America annual report below. You can navigate through the pages in the report by either clicking on the pages listed below, or by using the keyword search tool below to find specific information within the annual report.-
 1
1 -
2
-
3
-
4
-
5
-
6
-
7
-
8
-
9
-
10
-
11
-
12
-
13
-
14
-
15
-
16
-
17
-
18
-
19
-
20
-
21
-
22
-
23
-
24
-
25
-
26
-
27
-
28
-
29
-
30
-
31
-
32
-
33
-
34
-
35
-
36
-
37
-
38
-
39
-
40
-
41
-
42
-
43
-
44
-
45
-
46
-
47
-
48
-
49
-
50
-
51
-
52
-
53
-
54
-
55
-
56
-
57
-
58
-
59
-
60
-
61
-
62
-
63
-
64
-
65
-
66
-
67
-
68
-
69
-
70
-
71
-
72
-
73
-
74
-
75
-
76
-
77
-
78
-
79
-
80
-
81
-
82
-
83
-
84
-
85
-
86
-
87
-
88
-
89
-
90
-
91
-
92
-
93
-
94
-
95
-
96
-
97
-
98
-
99
-
100
-
101
-
102
-
103
-
104
-
105
-
106
-
107
-
108
-
109
-
110
-
111
-
112
-
113
-
114
-
115
-
116
-
117
-
118
-
119
-
120
-
121
-
122
-
123
-
124
-
125
-
126
-
127
-
128
-
129
-
130
-
131
-
132
-
133
-
134
-
135
-
136
-
137
-
138
-
139
-
140
-
141
-
142
-
143
-
144
-
145
-
146
-
147
-
148
-
149
-
150
-
151
-
152
-
153
-
154
-
155
-
156
-
157
-
158
-
159
-
160
-
161
-
162
-
163
-
164
-
165
-
166
-
167
-
168
-
169
-
170
-
171
-
172
-
173
-
174
-
175
-
176
-
177
-
178
-
179
-
180
-
181
-
182
-
183
-
184
-
185
-
186
-
187
-
188
-
189
-
190
-
191
-
192
-
193
-
194
-
195
-
196
-
197
-
198
-
199
-
200
-
201
-
202
-
203
-
204
-
205
-
206
-
207
-
208
-
209
-
210
-
211
-
212
-
213
-
214
-
 215
215 -
 216
216 -
 217
217 -
 218
218 -
 219
219 -
 220
220 -
 221
221 -
 222
222 -
 223
223 -
 224
224 -
 225
225 -
 226
226 -
 227
227 -
 228
228 -
 229
229 -
 230
230 -
 231
231 -
 232
232 -
 233
233 -
 234
234 -
 235
235 -
236
-
237
-
238
-
239
-
240
-
241
-
242
-
243
-
244
-
245
-
246
-
247
-
248
-
249
-
250
-
251
-
252
-
253
-
254
-
255
-
256
-
257
-
258
-
259
-
260
-
261
-
262
-
263
-
264
-
265
-
266
-
267
-
268
-
269
-
270
-
271
-
272
-
273
-
274
-
275
-
276
-
277
-
278
-
279
-
280
-
281
-
282
-
283
-
284
 |
 |

Bank of America 2012 223
NOTE 13 Commitments and Contingencies
In the normal course of business, the Corporation enters into a
number of off-balance sheet commitments. These commitments
expose the Corporation to varying degrees of credit and market
risk and are subject to the same credit and market risk limitation
reviews as those instruments recorded on the Corporation’s
Consolidated Balance Sheet.
Credit Extension Commitments
The Corporation enters into commitments to extend credit such
as loan commitments, SBLCs and commercial letters of credit to
meet the financing needs of its customers. The Credit Extension
Commitments table includes the notional amount of unfunded
legally binding lending commitments net of amounts distributed
(e.g., syndicated) to other financial institutions of $23.9 billion
and $27.1 billion at December 31, 2012 and 2011. At
December 31, 2012, the carrying amount of these commitments,
excluding commitments accounted for under the fair value option,
was $534 million, including deferred revenue of $21 million and
a reserve for unfunded lending commitments of $513 million. At
December 31, 2011, the comparable amounts were $741 million,
$27 million and $714 million, respectively. The carrying amount
of these commitments is classified in accrued expenses and other
liabilities on the Corporation’s Consolidated Balance Sheet.
The table below also includes the notional amount of
commitments of $18.3 billion and $25.7 billion at December 31,
2012 and 2011 that are accounted for under the fair value option.
However, the table below excludes cumulative net fair value
adjustments of $528 million and $1.2 billion on these
commitments, which are classified in accrued expenses and other
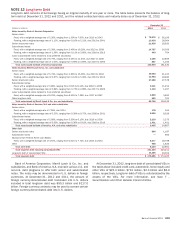
liabilities. For information regarding the Corporation’s loan
commitments accounted for under the fair value option, see Note
22 – Fair Value Option.
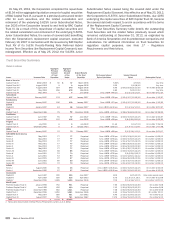
Credit Extension Commitments
December 31, 2012
(Dollars in millions)
Expire in One
Year or Less
Expire After
One
Year Through
Three Years
Expire After
Three
Years Through
Five Years
Expire After
Five
Years Total
Notional amount of credit extension commitments
Loan commitments $ 103,791 $ 83,885 $ 130,805 $ 19,942 $ 338,423
Home equity lines of credit 2,134 13,584 23,344 21,856 60,918
Standby letters of credit and financial guarantees (1) 24,593 11,387 3,094 4,751 43,825
Letters of credit 2,003 70 10 546 2,629
Legally binding commitments 132,521 108,926 157,253 47,095 445,795
Credit card lines (2) 414,044 — — —414,044
Total credit extension commitments $ 546,565 $ 108,926 $ 157,253 $ 47,095 $ 859,839
December 31, 2011
Notional amount of credit extension commitments
Loan commitments $ 96,291 $ 85,413 $ 120,770 $ 15,009 $ 317,483
Home equity lines of credit 1,679 7,765 20,963 37,066 67,473
Standby letters of credit and financial guarantees (1) 26,965 18,932 6,433 5,505 57,835
Letters of credit 2,828 27 5 383 3,243
Legally binding commitments 127,763 112,137 148,171 57,963 446,034
Credit card lines (2) 449,097 — — — 449,097
Total credit extension commitments $ 576,860 $ 112,137 $ 148,171 $ 57,963 $ 895,131
(1) The notional amounts of SBLCs and financial guarantees classified as investment grade and non-investment grade based on the credit quality of the underlying reference name within the instrument
were $31.5 billion and $11.6 billion at December 31, 2012, and $39.2 billion and $17.8 billion at December 31, 2011. Amounts include consumer SBLCs of $669 million and $859 million at
December 31, 2012 and 2011.
(2) Includes business card unused lines of credit.
Legally binding commitments to extend credit generally have
specified rates and maturities. Certain of these commitments have
adverse change clauses that help to protect the Corporation
against deterioration in the borrower’s ability to pay.
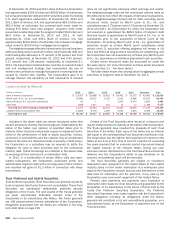
Other Commitments
Global Principal Investments and Other Equity
Investments
At December 31, 2012 and 2011, the Corporation had unfunded
equity investment commitments of $307 million and $772 million.
In light of proposed Basel regulatory capital changes related to
unfunded commitments, over the past three years, the Corporation
has actively reduced these commitments in a series of sale
transactions involving its private equity fund investments.
Other Commitments
At December 31, 2012 and 2011, the Corporation had
commitments to purchase loans (e.g., residential mortgage and
commercial real estate) of $1.3 billion and $2.5 billion, which upon
settlement will be included in loans or LHFS.
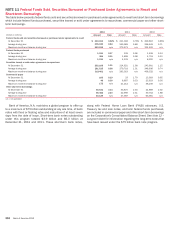
At December 31, 2012 and 2011, the Corporation had
commitments to enter into forward-dated resale and securities
borrowing agreements of $67.3 billion and $67.0 billion and
commitments to enter into forward-dated repurchase and
securities lending agreements of $42.3 billion and $42.0 billion.
All of these commitments expire within the next 12 months.
The Corporation is a party to operating leases for certain of its
premises and equipment. Commitments under these leases are
approximately $3.0 billion, $2.5 billion, $2.1 billion, $1.7 billion
and $1.5 billion for 2013 through 2017, respectively, and $6.2
billion in the aggregate for all years thereafter.