Bank of America 2012 Annual Report Download - page 199
Download and view the complete annual report
Please find page 199 of the 2012 Bank of America annual report below. You can navigate through the pages in the report by either clicking on the pages listed below, or by using the keyword search tool below to find specific information within the annual report.-
 1
1 -
2
-
3
-
4
-
5
-
6
-
7
-
8
-
9
-
10
-
11
-
12
-
13
-
14
-
15
-
16
-
17
-
18
-
19
-
20
-
21
-
22
-
23
-
24
-
25
-
26
-
27
-
28
-
29
-
30
-
31
-
32
-
33
-
34
-
35
-
36
-
37
-
38
-
39
-
40
-
41
-
42
-
43
-
44
-
45
-
46
-
47
-
48
-
49
-
50
-
51
-
52
-
53
-
54
-
55
-
56
-
57
-
58
-
59
-
60
-
61
-
62
-
63
-
64
-
65
-
66
-
67
-
68
-
69
-
70
-
71
-
72
-
73
-
74
-
75
-
76
-
77
-
78
-
79
-
80
-
81
-
82
-
83
-
84
-
85
-
86
-
87
-
88
-
89
-
90
-
91
-
92
-
93
-
94
-
95
-
96
-
97
-
98
-
99
-
100
-
101
-
102
-
103
-
104
-
105
-
106
-
107
-
108
-
109
-
110
-
111
-
112
-
113
-
114
-
115
-
116
-
117
-
118
-
119
-
120
-
121
-
122
-
123
-
124
-
125
-
126
-
127
-
128
-
129
-
130
-
131
-
132
-
133
-
134
-
135
-
136
-
137
-
138
-
139
-
140
-
141
-
142
-
143
-
144
-
145
-
146
-
147
-
148
-
149
-
150
-
151
-
152
-
153
-
154
-
155
-
156
-
157
-
158
-
159
-
160
-
161
-
162
-
163
-
164
-
165
-
166
-
167
-
168
-
169
-
170
-
171
-
172
-
173
-
174
-
175
-
176
-
177
-
178
-
179
-
180
-
181
-
182
-
183
-
184
-
185
-
186
-
187
-
188
-
 189
189 -
 190
190 -
 191
191 -
 192
192 -
 193
193 -
 194
194 -
 195
195 -
 196
196 -
 197
197 -
 198
198 -
 199
199 -
 200
200 -
 201
201 -
 202
202 -
 203
203 -
 204
204 -
 205
205 -
 206
206 -
 207
207 -
 208
208 -
 209
209 -
210
-
211
-
212
-
213
-
214
-
215
-
216
-
217
-
218
-
219
-
220
-
221
-
222
-
223
-
224
-
225
-
226
-
227
-
228
-
229
-
230
-
231
-
232
-
233
-
234
-
235
-
236
-
237
-
238
-
239
-
240
-
241
-
242
-
243
-
244
-
245
-
246
-
247
-
248
-
249
-
250
-
251
-
252
-
253
-
254
-
255
-
256
-
257
-
258
-
259
-
260
-
261
-
262
-
263
-
264
-
265
-
266
-
267
-
268
-
269
-
270
-
271
-
272
-
273
-
274
-
275
-
276
-
277
-
278
-
279
-
280
-
281
-
282
-
283
-
284
 |
 |

Bank of America 2012 197
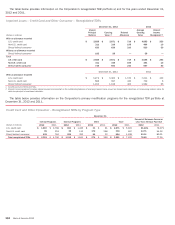
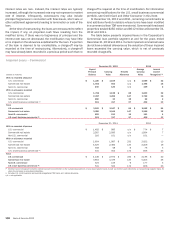
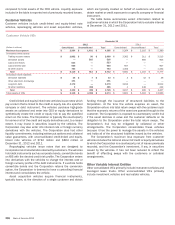
The table below presents the December 31, 2012 and 2011
unpaid principal balance and carrying value of commercial loans
that were modified as TDRs during 2012 and 2011, and net charge-
offs that were recorded during the period in which the modification
occurred.
Commercial – TDRs Entered into During 2012 and 2011
December 31, 2012 2012
(Dollars in millions)
Unpaid
Principal
Balance
Carrying
Value
Net
Charge-offs
U.S. commercial $ 590 $ 558 $ 34
Commercial real estate 793 721 20
Non-U.S. commercial 90 89 1
U.S. small business commercial (1) 22 22 5
Total $ 1,495 $ 1,390 $ 60
December 31, 2011 2011
U.S. commercial $ 1,381 $ 1,211 $ 74
Commercial real estate 1,604 1,333 152
Non-U.S. commercial 44 44 —
U.S. small business commercial (1) 58 59 10
Total $ 3,087 $ 2,647 $ 236
(1) U.S. small business commercial TDRs are comprised of renegotiated small business card loans.
A commercial TDR is generally deemed to be in payment default
when the loan is 90 days or more past due, including delinquencies
that were not resolved as part of the modification. U.S. small
business commercial TDRs are deemed to be in payment default
during the quarter in which a borrower misses the second of two
consecutive payments. Payment defaults are one of the factors
considered when projecting future cash flows, along with
observable market prices or fair value of collateral when measuring
the allowance for loan losses. TDRs that were in payment default
at December 31, 2012 and 2011 had a carrying value of $130
million and $164 million for U.S. commercial, $455 million and
$446 million for commercial real estate and $18 million and $68
million for U.S. small business commercial.
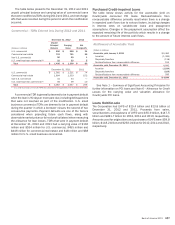
Purchased Credit-impaired Loans
The table below shows activity for the accretable yield on
Countrywide consumer PCI loans. Reclassifications from
nonaccretable difference primarily result when there is a change
in expected cash flows due to various factors, including changes
in interest rates on variable-rate loans and prepayment
assumptions. Changes in the prepayment assumption affect the
expected remaining life of the portfolio which results in a change
to the amount of future interest cash flows.
Rollforward of Accretable Yield
(Dollars in millions)
Accretable yield, January 1, 2011 $ 5,481
Accretion (1,285)
Disposals/transfers (118)
Reclassifications from nonaccretable difference 912
Accretable yield, December 31, 2011 4,990
Accretion (1,034)
Disposals/transfers (109)
Reclassifications from nonaccretable difference 797
Accretable yield, December 31, 2012 $ 4,644
See Note 1 – Summary of Significant Accounting Principles for
further information on PCI loans and Note 6 – Allowance for Credit
Losses for the carrying value and valuation allowance for
Countrywide PCI loans.
Loans Held-for-sale
The Corporation had LHFS of $19.4 billion and $13.8 billion at
December 31, 2012 and 2011. Proceeds from sales,
securitizations and paydowns of LHFS were $55.9 billion, $147.5
billion and $281.7 billion for 2012, 2011 and 2010, respectively.
Amounts used for originations and purchases of LHFS were $59.8
billion, $118.2 billion and $263.0 billion for 2012, 2011 and 2010,
respectively.