Bank of America 2012 Annual Report Download - page 146
Download and view the complete annual report
Please find page 146 of the 2012 Bank of America annual report below. You can navigate through the pages in the report by either clicking on the pages listed below, or by using the keyword search tool below to find specific information within the annual report.-
 1
1 -
2
-
3
-
4
-
5
-
6
-
7
-
8
-
9
-
10
-
11
-
12
-
13
-
14
-
15
-
16
-
17
-
18
-
19
-
20
-
21
-
22
-
23
-
24
-
25
-
26
-
27
-
28
-
29
-
30
-
31
-
32
-
33
-
34
-
35
-
36
-
37
-
38
-
39
-
40
-
41
-
42
-
43
-
44
-
45
-
46
-
47
-
48
-
49
-
50
-
51
-
52
-
53
-
54
-
55
-
56
-
57
-
58
-
59
-
60
-
61
-
62
-
63
-
64
-
65
-
66
-
67
-
68
-
69
-
70
-
71
-
72
-
73
-
74
-
75
-
76
-
77
-
78
-
79
-
80
-
81
-
82
-
83
-
84
-
85
-
86
-
87
-
88
-
89
-
90
-
91
-
92
-
93
-
94
-
95
-
96
-
97
-
98
-
99
-
100
-
101
-
102
-
103
-
104
-
105
-
106
-
107
-
108
-
109
-
110
-
111
-
112
-
113
-
114
-
115
-
116
-
117
-
118
-
119
-
120
-
121
-
122
-
123
-
124
-
125
-
126
-
127
-
128
-
129
-
130
-
131
-
132
-
133
-
134
-
135
-
 136
136 -
 137
137 -
 138
138 -
 139
139 -
 140
140 -
 141
141 -
 142
142 -
 143
143 -
 144
144 -
 145
145 -
 146
146 -
 147
147 -
 148
148 -
 149
149 -
 150
150 -
 151
151 -
 152
152 -
 153
153 -
 154
154 -
 155
155 -
 156
156 -
157
-
158
-
159
-
160
-
161
-
162
-
163
-
164
-
165
-
166
-
167
-
168
-
169
-
170
-
171
-
172
-
173
-
174
-
175
-
176
-
177
-
178
-
179
-
180
-
181
-
182
-
183
-
184
-
185
-
186
-
187
-
188
-
189
-
190
-
191
-
192
-
193
-
194
-
195
-
196
-
197
-
198
-
199
-
200
-
201
-
202
-
203
-
204
-
205
-
206
-
207
-
208
-
209
-
210
-
211
-
212
-
213
-
214
-
215
-
216
-
217
-
218
-
219
-
220
-
221
-
222
-
223
-
224
-
225
-
226
-
227
-
228
-
229
-
230
-
231
-
232
-
233
-
234
-
235
-
236
-
237
-
238
-
239
-
240
-
241
-
242
-
243
-
244
-
245
-
246
-
247
-
248
-
249
-
250
-
251
-
252
-
253
-
254
-
255
-
256
-
257
-
258
-
259
-
260
-
261
-
262
-
263
-
264
-
265
-
266
-
267
-
268
-
269
-
270
-
271
-
272
-
273
-
274
-
275
-
276
-
277
-
278
-
279
-
280
-
281
-
282
-
283
-
284
 |
 |

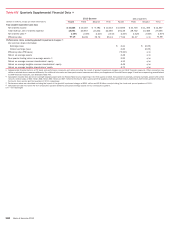
144 Bank of America 2012
Table XVII Quarterly Reconciliations to GAAP Financial Measures (1)
2012 Quarters 2011 Quarters
(Dollars in millions) Fourth Third Second First Fourth Third Second First
Reconciliation of net interest income to net interest income on a fully
taxable-equivalent basis
Net interest income $ 10,324 $ 9,938 $ 9,548 $ 10,846 $ 10,701 $ 10,490 $11,246 $12,179
Fully taxable-equivalent adjustment 231 229 234 207 258 249 247 218
Net interest income on a fully taxable-equivalent basis $ 10,555 $ 10,167 $ 9,782 $ 11,053 $ 10,959 $ 10,739 $11,493 $12,397
Reconciliation of total revenue, net of interest expense to total revenue,
net of interest expense on a fully taxable-equivalent basis
Total revenue, net of interest expense $ 18,660 $ 20,428 $ 21,968 $ 22,278 $ 24,888 $ 28,453 $13,236 $26,877
Fully taxable-equivalent adjustment 231 229 234 207 258 249 247 218
Total revenue, net of interest expense on a fully taxable-equivalent
basis $ 18,891 $ 20,657 $ 22,202 $ 22,485 $ 25,146 $ 28,702 $13,483 $27,095
Reconciliation of total noninterest expense to total noninterest expense,
excluding goodwill impairment charges
Total noninterest expense $ 18,360 $ 17,544 $ 17,048 $ 19,141 $ 19,522 $ 17,613 $22,856 $20,283
Goodwill impairment charges —— — — (581) — (2,603) —
Total noninterest expense, excluding goodwill impairment charges $ 18,360 $ 17,544 $ 17,048 $ 19,141 $ 18,941 $ 17,613 $20,253 $20,283
Reconciliation of income tax expense (benefit) to income tax expense
(benefit) on a fully taxable-equivalent basis
Income tax expense (benefit) $ (2,636) $770 $ 684 $ 66 $ 441 $ 1,201 $ (4,049) $ 731
Fully taxable-equivalent adjustment 231 229 234 207 258 249 247 218
Income tax expense (benefit) on a fully taxable-equivalent basis $ (2,405) $999 $ 918 $ 273 $ 699 $ 1,450 $ (3,802) $ 949
Reconciliation of net income (loss) to net income (loss), excluding
goodwill impairment charges
Net income (loss) $ 732 $340 $ 2,463 $ 653 $ 1,991 $ 6,232 $ (8,826) $ 2,049
Goodwill impairment charges —— — — 581 — 2,603 —
Net income (loss), excluding goodwill impairment charges $ 732 $340 $ 2,463 $ 653 $ 2,572 $ 6,232 $ (6,223) $ 2,049
Reconciliation of net income (loss) applicable to common shareholders to
net income (loss) applicable to common shareholders, excluding
goodwill impairment charges
Net income (loss) applicable to common shareholders $ 367 $ (33) $ 2,098 $ 328 $ 1,584 $ 5,889 $ (9,127) $ 1,739
Goodwill impairment charges —— — — 581 — 2,603 —
Net income (loss) applicable to common shareholders, excluding
goodwill impairment charges $ 367 $ (33) $ 2,098 $ 328 $ 2,165 $ 5,889 $ (6,524) $ 1,739
Reconciliation of average common shareholders’ equity to average
tangible common shareholders’ equity
Common shareholders’ equity $ 219,744 $ 217,273 $ 216,782 $ 214,150 $ 209,324 $ 204,928 $ 218,505 $ 214,206
Goodwill (69,976) (69,976) (69,976) (69,967) (70,647) (71,070) (73,748) (73,922)
Intangible assets (excluding MSRs) (6,874) (7,194) (7,533) (7,869) (8,566) (9,005) (9,394) (9,769)
Related deferred tax liabilities 2,490 2,556 2,626 2,700 2,775 2,852 2,932 3,035
Tangible common shareholders’ equity $ 145,384 $ 142,659 $ 141,899 $ 139,014 $ 132,886 $ 127,705 $ 138,295 $ 133,550
(1) Presents reconciliations of non-GAAP financial measures to GAAP financial measures. We believe the use of these non-GAAP financial measures provides additional clarity in assessing the results
of the Corporation. Other companies may define or calculate these measures differently. For more information on non-GAAP financial measures and ratios we use in assessing the results of the
Corporation, see Supplemental Financial Data on page 31.