Bank of America 2012 Annual Report Download - page 175
Download and view the complete annual report
Please find page 175 of the 2012 Bank of America annual report below. You can navigate through the pages in the report by either clicking on the pages listed below, or by using the keyword search tool below to find specific information within the annual report.-
 1
1 -
2
-
3
-
4
-
5
-
6
-
7
-
8
-
9
-
10
-
11
-
12
-
13
-
14
-
15
-
16
-
17
-
18
-
19
-
20
-
21
-
22
-
23
-
24
-
25
-
26
-
27
-
28
-
29
-
30
-
31
-
32
-
33
-
34
-
35
-
36
-
37
-
38
-
39
-
40
-
41
-
42
-
43
-
44
-
45
-
46
-
47
-
48
-
49
-
50
-
51
-
52
-
53
-
54
-
55
-
56
-
57
-
58
-
59
-
60
-
61
-
62
-
63
-
64
-
65
-
66
-
67
-
68
-
69
-
70
-
71
-
72
-
73
-
74
-
75
-
76
-
77
-
78
-
79
-
80
-
81
-
82
-
83
-
84
-
85
-
86
-
87
-
88
-
89
-
90
-
91
-
92
-
93
-
94
-
95
-
96
-
97
-
98
-
99
-
100
-
101
-
102
-
103
-
104
-
105
-
106
-
107
-
108
-
109
-
110
-
111
-
112
-
113
-
114
-
115
-
116
-
117
-
118
-
119
-
120
-
121
-
122
-
123
-
124
-
125
-
126
-
127
-
128
-
129
-
130
-
131
-
132
-
133
-
134
-
135
-
136
-
137
-
138
-
139
-
140
-
141
-
142
-
143
-
144
-
145
-
146
-
147
-
148
-
149
-
150
-
151
-
152
-
153
-
154
-
155
-
156
-
157
-
158
-
159
-
160
-
161
-
162
-
163
-
164
-
 165
165 -
 166
166 -
 167
167 -
 168
168 -
 169
169 -
 170
170 -
 171
171 -
 172
172 -
 173
173 -
 174
174 -
 175
175 -
 176
176 -
 177
177 -
 178
178 -
 179
179 -
 180
180 -
 181
181 -
 182
182 -
 183
183 -
 184
184 -
 185
185 -
186
-
187
-
188
-
189
-
190
-
191
-
192
-
193
-
194
-
195
-
196
-
197
-
198
-
199
-
200
-
201
-
202
-
203
-
204
-
205
-
206
-
207
-
208
-
209
-
210
-
211
-
212
-
213
-
214
-
215
-
216
-
217
-
218
-
219
-
220
-
221
-
222
-
223
-
224
-
225
-
226
-
227
-
228
-
229
-
230
-
231
-
232
-
233
-
234
-
235
-
236
-
237
-
238
-
239
-
240
-
241
-
242
-
243
-
244
-
245
-
246
-
247
-
248
-
249
-
250
-
251
-
252
-
253
-
254
-
255
-
256
-
257
-
258
-
259
-
260
-
261
-
262
-
263
-
264
-
265
-
266
-
267
-
268
-
269
-
270
-
271
-
272
-
273
-
274
-
275
-
276
-
277
-
278
-
279
-
280
-
281
-
282
-
283
-
284
 |
 |

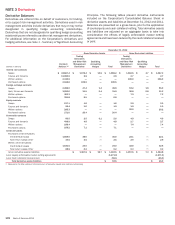
Bank of America 2012 173
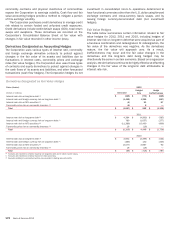
Cash Flow and Net Investment Hedges
The table below summarizes certain information related to cash
flow hedges and net investment hedges for 2012, 2011 and 2010.
During the next 12 months, net losses in accumulated OCI of $981
million ($618 million after-tax) on derivative instruments that
qualify as cash flow hedges are expected to be reclassified into
earnings. These net losses reclassified into earnings are expected
to primarily reduce net interest income related to the respective
hedged items. Amounts related to commodity price risk
reclassified from accumulated OCI are recorded in trading account
profits with the underlying hedged item. Amounts related to price
risk on restricted stock awards reclassified from accumulated OCI
are recorded in personnel expense.
Amounts related to foreign exchange risk recognized in
accumulated OCI on derivatives exclude pre-tax losses of $7
million, and pre-tax gains of $82 million and $192 million related
to long-term debt designated as a net investment hedge for 2012,
2011 and 2010, respectively.
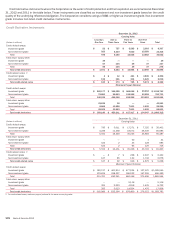
Derivatives Designated as Cash Flow and Net Investment Hedges
2012
(Dollars in millions, amounts pre-tax)
Gains (losses)
Recognized in
Accumulated OCI
on Derivatives
Gains (losses)
in Income
Reclassified from
Accumulated OCI
Hedge
Ineffectiveness and
Amounts Excluded
from Effectiveness
Testing (1)
Cash flow hedges
Interest rate risk on variable rate portfolios $ 10 $ (957)$ —
Price risk on restricted stock awards 420 (78) —
Total $ 430 $(1,035)$ —
Net investment hedges
Foreign exchange risk $(771) $ (26) $ (269)
2011
Cash flow hedges
Interest rate risk on variable rate portfolios $ (2,079) $ (1,392) $ (8)
Commodity price risk on forecasted purchases and sales (3) 6 (3)
Price risk on restricted stock awards (408) (231) —
Total $ (2,490) $ (1,617) $ (11)
Net investment hedges
Foreign exchange risk $ 1,055 $ 384 $ (572)
2010
Cash flow hedges
Interest rate risk on variable rate portfolios $ (1,876) $ (410) $ (30)
Commodity price risk on forecasted purchases and sales 32 25 11
Price risk on restricted stock awards (97) (33) —
Price risk on equity investments included in AFS securities 186 (226) —
Total $ (1,755) $ (644) $ (19)
Net investment hedges
Foreign exchange risk $ (482) $ —$ (315)
(1) Amounts related to derivatives designated as cash flow hedges represent hedge ineffectiveness and amounts related to net investment hedges represent amounts excluded from effectiveness
testing.
The Corporation enters into equity total return swaps to hedge
a portion of RSUs granted to certain employees as part of their
compensation. Certain awards contain clawback provisions which
permit the Corporation to cancel all or a portion of the award under
specified circumstances, and certain awards may be settled in
cash. These RSUs are accrued as liabilities over the vesting period
and adjusted to fair value based on changes in the share price of
the Corporation’s common stock. From time to time, the
Corporation may enter into equity derivatives to minimize the
change in the expense driven by fluctuations in the share price of
the common stock during the vesting period of any RSUs that may
be granted, if any, subject to similar or other terms and conditions.
Certain of these derivatives are designated as cash flow hedges
of unrecognized unvested awards with changes in fair value of the
hedge recorded in accumulated OCI and reclassified into earnings
in the same period as the RSUs affect earnings. The remaining
derivatives are other risk management derivatives and changes in
fair value are recorded in personnel expense. For more information
on RSUs and related hedges, see Note 19 – Stock-based
Compensation Plans.